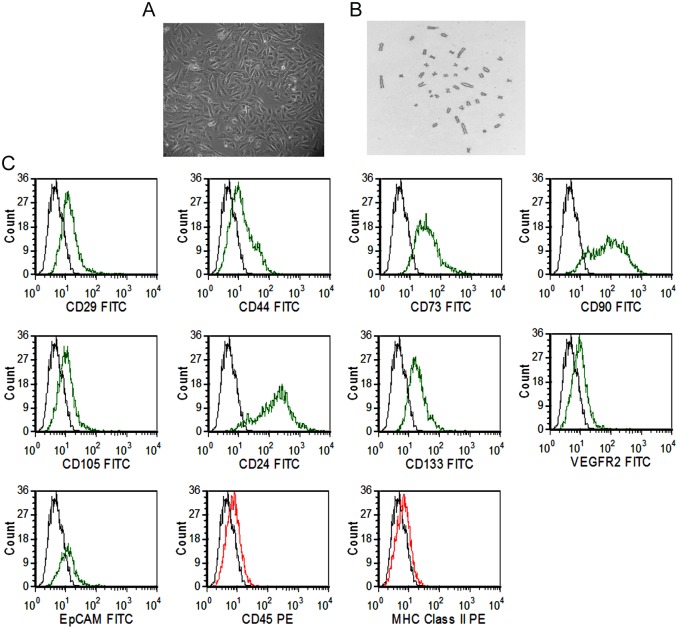
Fig 1. Morphology, karyotype and phenotypic characterization of fetal kidney cells.
(A) Representative photomicrograph (10X) of fetal kidney cells in culture, showing spindle-shape and polygonal morphology. (B) The fetal kidney cells showing normal karyotype at 3rd passage (10X). (C) Flow cytometric analysis of fetal kidney cells showing expression of surface markers CD29, CD44, CD73, CD90, CD105, CD24, CD133, VEGFR2, EpCAM, CD45 and MHC class II (green or red lines, detected with FITC- or PE- conjugated antibodies, respectively) with isotype controls (black lines).

