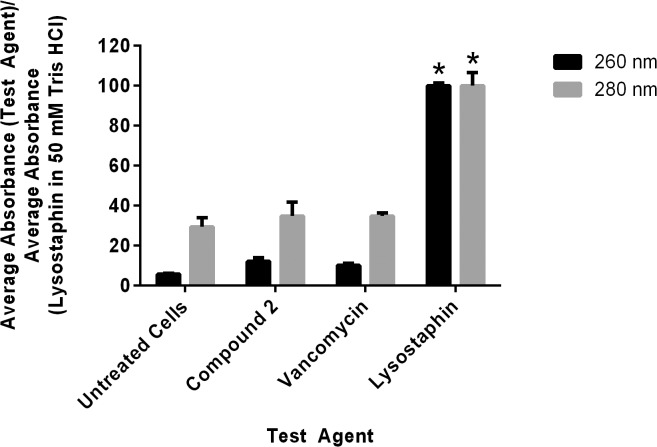
Fig 3. Cell leakage analysis of compound 2, vancomycin, and lysostaphin against methicillin-resistant Staphylococcus pseudintermedius SP3.
Untreated cells represent the negative control while lysostaphin (in 50 mM Tris-HCl, pH 8.00) served as the positive control. The figure represents the ratio of the average absorbance value obtained for each treatment against the average absorbance value obtained for the positive control (at both 260 and 280 nm). The error bars represent standard deviation values of two experiments where triplicate samples were used for each treatment option. A one-way ANOVA, with post hoc Tukey's multiple comparisons test, P ≤ 0.05, demonstrated no statistical difference between the values obtained for compound 2 and vancomycin relative to the untreated cells but significant difference (denoted by the asterisks) in the absorbance values obtained for lysostaphin as compared to both untreated cells and compound 2.

