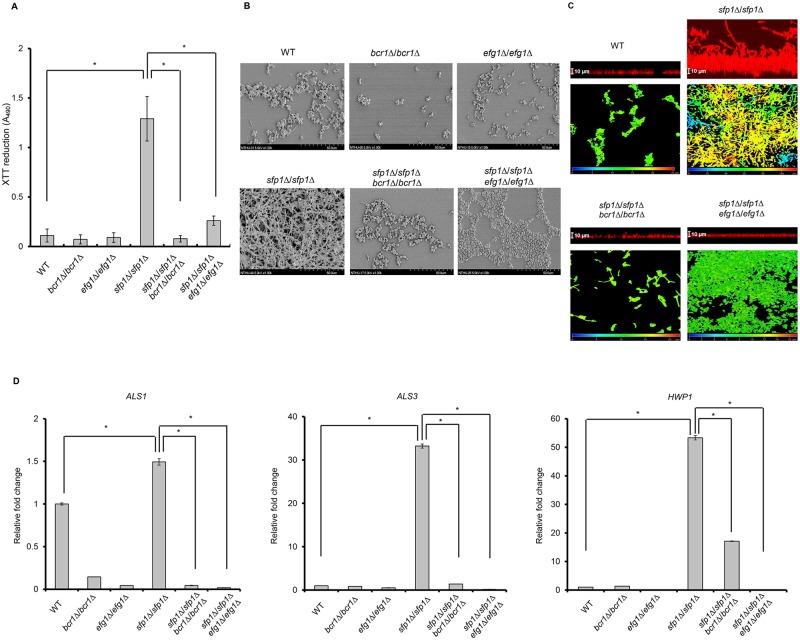
Fig 7. Sfp1 regulates biofilm formation through Bcr1 and Efg1.
(A) Biofilm formation was assessed using the XTT reduction assay. The results are presented as the mean ± SD from three independent experiments. *p < 0.05 for sfp1Δ/sfp1Δ vs. WT, bcr1Δ/bcr1Δ/sfp1Δ/sfp1Δ or efg1Δ/efg1Δ/sfp1Δ/sfp1Δ mutant cells. (B) The biofilm structure was examined using scanning electron microscopy. Pictures were taken at a 1,000× magnification. The cells were grown on polystyrene coverslips for 24 h to form biofilms. (C) The biofilm structure was examined using confocal scanning laser microscopy (CSLM). Biofilms were formed on the polystyrene coverslips in SC medium at 37°C with 5% CO2 for 24 h. After washing, the cells were stained with 0.2 mg/ml of calcofluor (Sigma F-3543, “Fluorescent brightener 28”) for CSLM visualization. Pictures were taken at a 400× magnification. (D) The expression of adhesin genes in biofilm cells was detected using RT real-time qPCR. PMA1 transcripts were used as an endogenous control. The results are presented as the mean ± SD from at least two independent experiments. *p < 0.05 for sfp1Δ/sfp1Δ vs. WT, bcr1Δ/bcr1Δ/sfp1Δ/sfp1Δ or efg1Δ/efg1Δ/sfp1Δ/sfp1Δ mutant cells.

