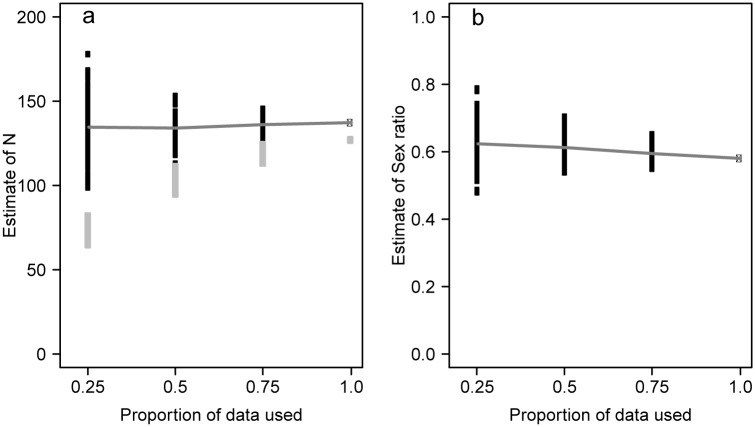
Fig 5. Simulation-based assessment of the effects of reducing the sample size (total number of analysed droppings) from the actual 466 to 75%, 50% and 25% on estimates of (a) total population size and (b) sex ratio.
For each scenario, 100 replicate subsamples from the 466 detections were drawn and the resulting data set analysed using our model. The grey horizontal line links the mean for each scenario and the estimate in the actual data set (proportion of data used: 1.0). The grey symbols in panel a indicate the observed number of individuals.

