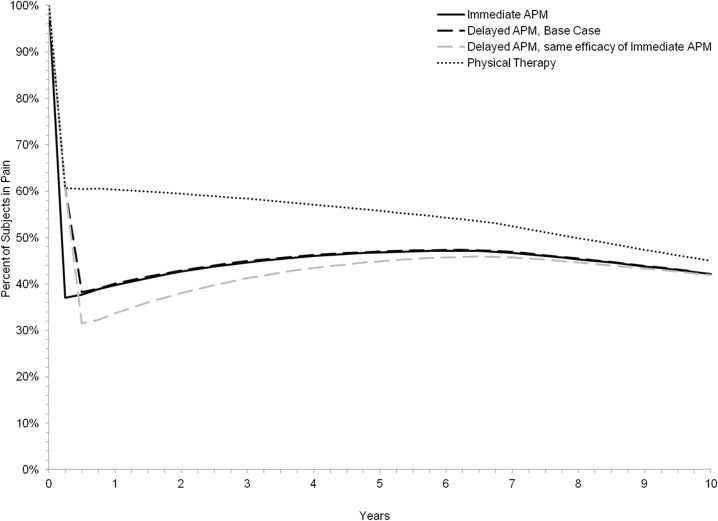
Fig 2. Percentage of Subjects in Moderate Pain, Stratified by Treatment Arm.
Fig 2 describes the percentage of subjects reporting pain within each of the evaluated three treatment strategies over the course of 10 years. Two trajectories are reported for the Delayed APM strategy, represented in black and gray dashed lines in the graph. The black dashed Delayed APM trajectory reflects the base case, where the surgery’s efficacy was calculated based on results reported by MeTeOR subjects who crossed over from the non-operative to the operative arm between months 3 and 6. The gray dashed ‘Delayed APM’ line reflects the sensitivity analysis of Delayed APM, where we assumed the efficacy of a delayed surgery following a failed PT regimen would be equal to that of an APM procedure immediately following a MT diagnosis.

