
Fig 1. Gambling task timeline.
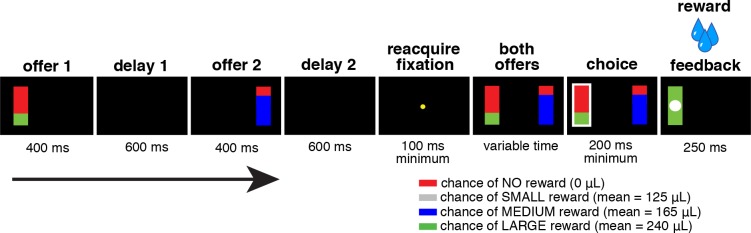
Two potential gambles for water reward were presented each trial. Gambles were represented by a rectangle, some proportion of which was grey, blue, or green, corresponding to a small, medium, or large reward respectively. The size of the grey, blue, or green portion corresponded to the probability that selecting that gamble would lead to the corresponding reward. Offers appeared in a random order one at a time with a one-second offset for 400 ms each. After fixation, both offers reappeared during a decision phase. Rewarded outcomes were accompanied by a white circle in the center of the chosen offer. These data are available in Data S1 on figshare (http://figshare.com/articles/Data_for_Signatures_of_value_comparison_in_ventral_striatum_neurons_/1332487).