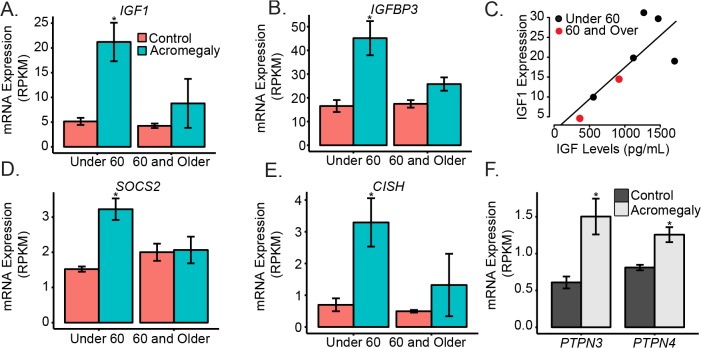
Fig 3. GH targets are differentially expressed in acromegaly subjects.
A) mRNA Expression of A) IGF1 and B) IGFBP3 transcript levels in adipose tissue from control and acromegalic patients (C) Comparason between IGF1 mRNA and IGF-1 serum levels in patients with acromegaly (D and E) Expression of mRNA for suppressors of growth hormone signaling (F) and Expression of tyrosine phosphatases associated with growth hormone signaling. Asterisks indicate q<0.05 for the separated under 60 and 60 or over cohorts for panels A, B, D and E and for the age adjusted combined analysis for panel F. Barplots are presented as mean +/- standard error of the mean.

