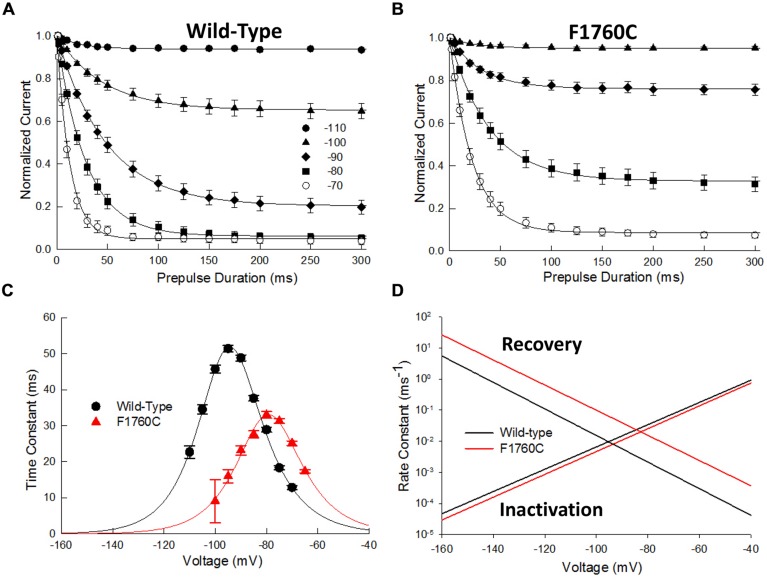
FIGURE 8.
The F1760C mutant alters closed-state inactivation. The onset of closed-state inactivation was measured by applying variable length prepulses (0–150 ms) to voltages between –110 and –70 mV. The cells were then returned to –140 mV for 1 ms before assessing availability with a standard test pulse to –10 mV for 20 ms. The peak currents were normalized and plotted versus the prepulse pulse duration. (A,B) Onset of closed-state inactivation of the wild-type and F1760C channels. The smooth curves are fits to single exponential functions. (C) Time constants of the wild-type and F1760C mutant obtained from panels (A,B) plotted versus the prepulse potential. The smooth curve is a fit to a two state model yielding the inactivation (β) and recovery (α) rate constants (See Materials and Methods). (D) Plot of β and α as a function of voltage.

