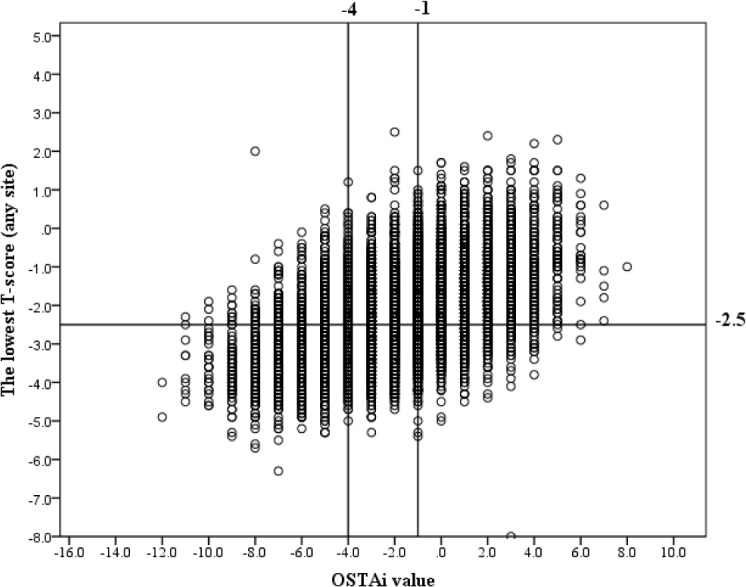
Fig 3. A plot of the OSTAi value versus the lowest T-score at any site.

The horizontal line indicates a T-score of -2.5. The vertical lines mark the OSTAi value cutoffs of -1 and -4, which identified postmenopausal women at low (≥ -1), medium (-1 to -4), and high risk (≤-4) for osteoporosis.
