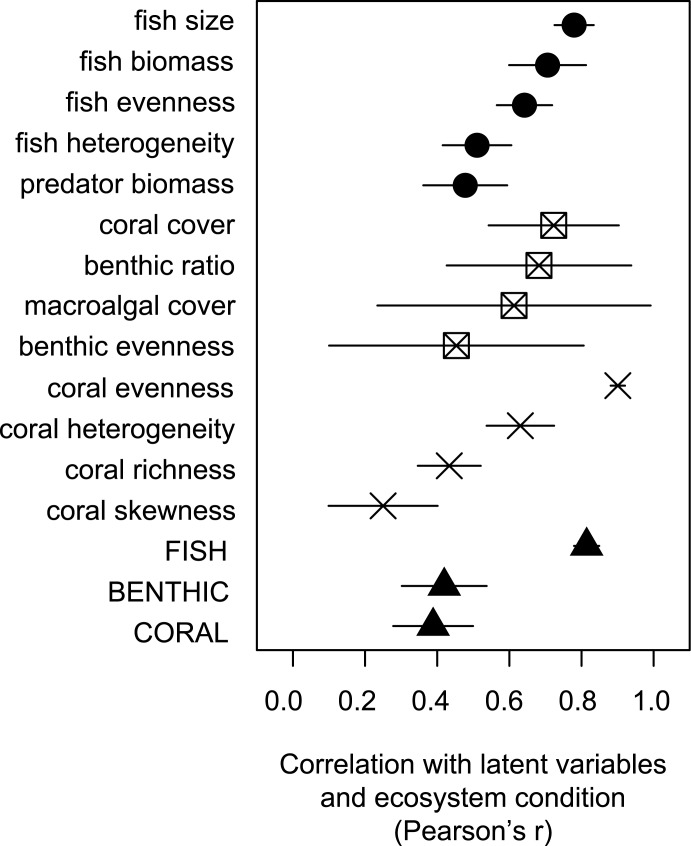
Fig 4. Sensitivity of ecosystem condition scores depicted by correlation coefficients between individual metrics and their respective latent variables (circles-fish, squares-benthic, and crosses-corals), or between latent variables and overall ecosystem condition (bottom triangles).
Error bars (thin lines) represent standard deviations associated with the differing jurisdiction and reef-habitat strata.

