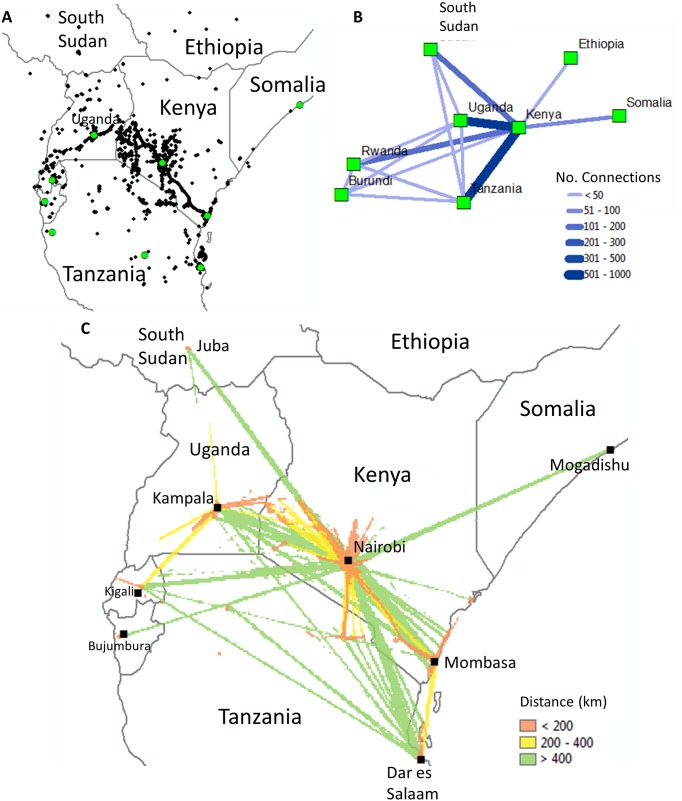
Fig 5. Maps illustrating (A) the distribution of geo-located tweets in the study area for users who crossed-borders (N = 770) (B) connections between Kenya and the surrounding countries and (C) a flow map showing the connectivity between different geographic locations by travel distance.
Map created using ArcGIS 10.2.

