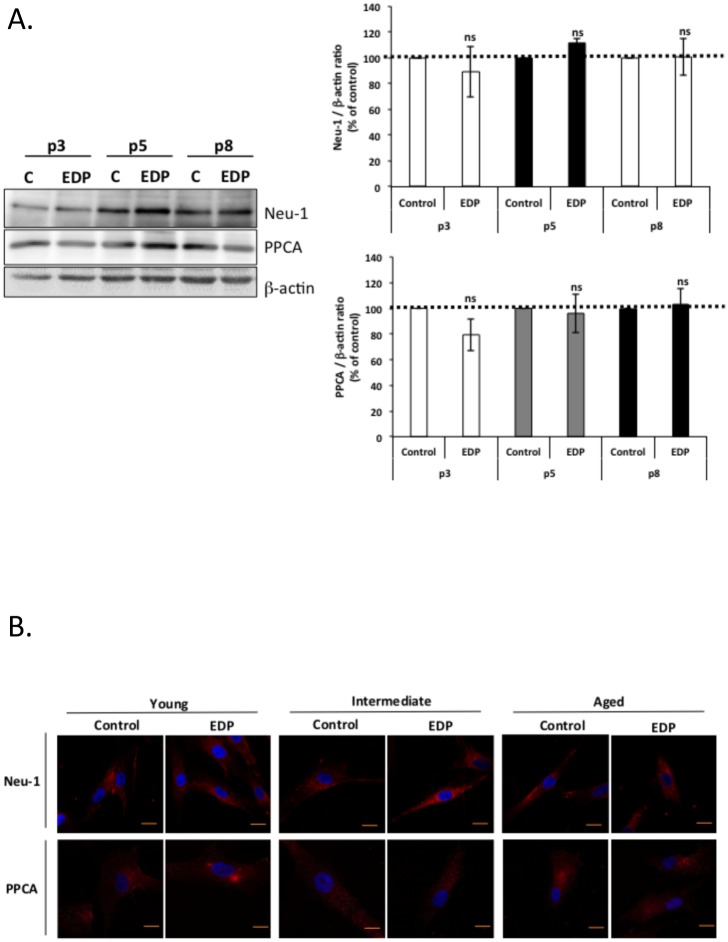
Fig 4. Analysis of protein expression and plasma membrane localization of Neu-1 and PPCA.
Young, intermediate and aged fibroblasts were represented by passage 3 (white), 5 (grey) and 8 (black bars). (A) Analysis of Neu-1 and PPCA protein levels during aging. Cells were stimulated or not for 24 hours with 50 μg/mL of EDP before protein extraction. Neu-1 and PPCA were then analyzed by Western blotting using anti-Neu-1 and anti-PPCA antibodies. Densitometric analysis was performed using the Quantity One software. The results were expressed as the ratio Neu-1/β-actin and PPCA/β-actin and normalized to the control expressed in percent. Dotted lines (100%) represent the values of the unstimulated controls. (B) Analysis of Neu-1 and PPCA localization during aging. Neu-1 and PPCA cell localizations were analyzed by confocal microscopy. Bar, 10 μm.

