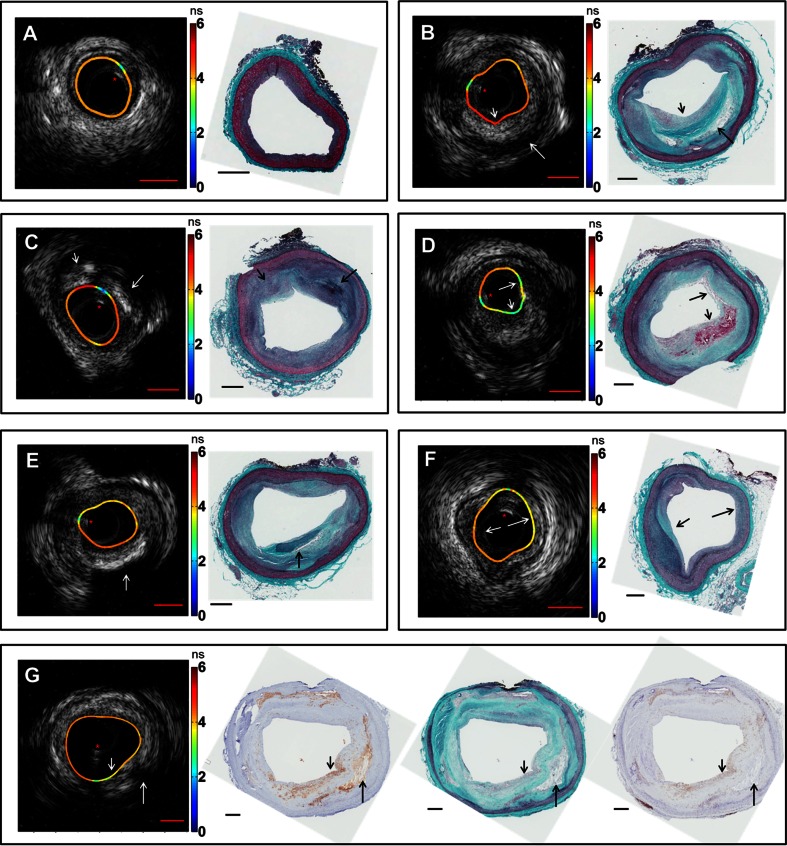
Fig. 2.
Representative images of co-registered IVUS, FLIm, and histology data showing different pathological features. Lifetime values (in ns) mapped onto the lumen surface are either from CH1 or CH2. Guide wire artifact is highlighted with a red asterisk. a DIT with uniform distribution of lifetime values over the lumen surface. IVUS shows minimal intimal thickening. b ThCFA and LFA. The thick cap (small arrow) is seen on both histology and IVUS with an underlying lipid-rich core (large arrow). Lifetime values at the cap region are higher due to increased amount of fibrous collagen. c PIT (small arrow) and FC (large arrow) are seen with varying echogenicities on IVUS as well as different lifetime values. d TCFA with intraplaque hemorrhage is seen with distinct lowering in lifetime values (arrows). IVUS is able to show burden of the TCFA core. e FC (arrow) is seen on IVUS as a region of high backscatter with a shadow. f FT is seen (small arrow) with increased lifetime values due to increase in collagen content as compared to regions with DIT (large arrow). g ThCFAM is seen with a fibrous cap (small arrow) rich in macrophages as confirmed in CD68-stained section (middle) along with CD45-stained section (right). Lipid-rich core (large arrow) is also seen on both IVUS and histology. Lowering in lifetime values is observed over the fibrous cap rich in macrophages compared to the surrounding regions in the lumen. Scale bars (red) on IVUS are 1 mm, and scale bars on histology (black) are 0.5 mm

