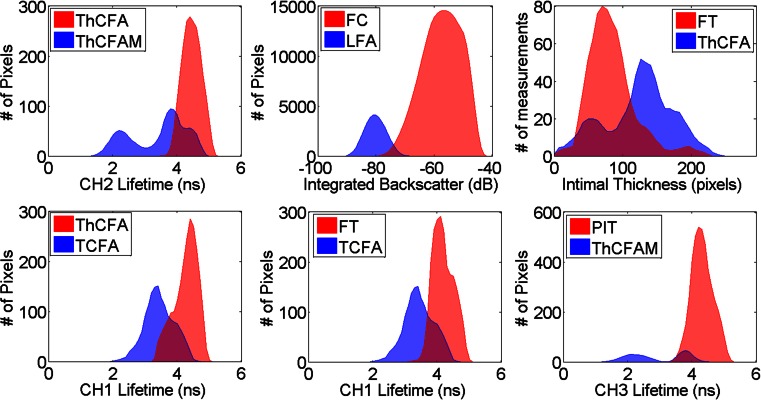
Fig. 3.
FLIm and IVUS parameter distribution for different pathology feature pairs. Parameters shown here are few of many that were found to be statistically different (post hoc Tukey’s test p < 0.001) between the pairs of pathological features (described in Table 1)

