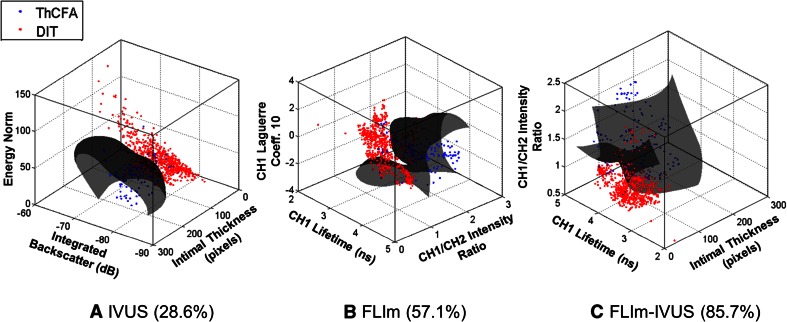
Fig. 5.
Three-dimensional scatter plots of training data for ThCFA and DIT using parameters from a IVUS, b FLIm, and c both FLIm and IVUS. Three imaging parameters were used for plotting purposes although up to 39 were used for the overall classification study. The SVM classifier hyperplane (gray) acts as a decision boundary for classification purposes. ThCFA detection sensitivity (reported in parenthesis) improves when both FLIm and IVUS parameters are used, enforcing the benefit of a bimodal imaging technique

