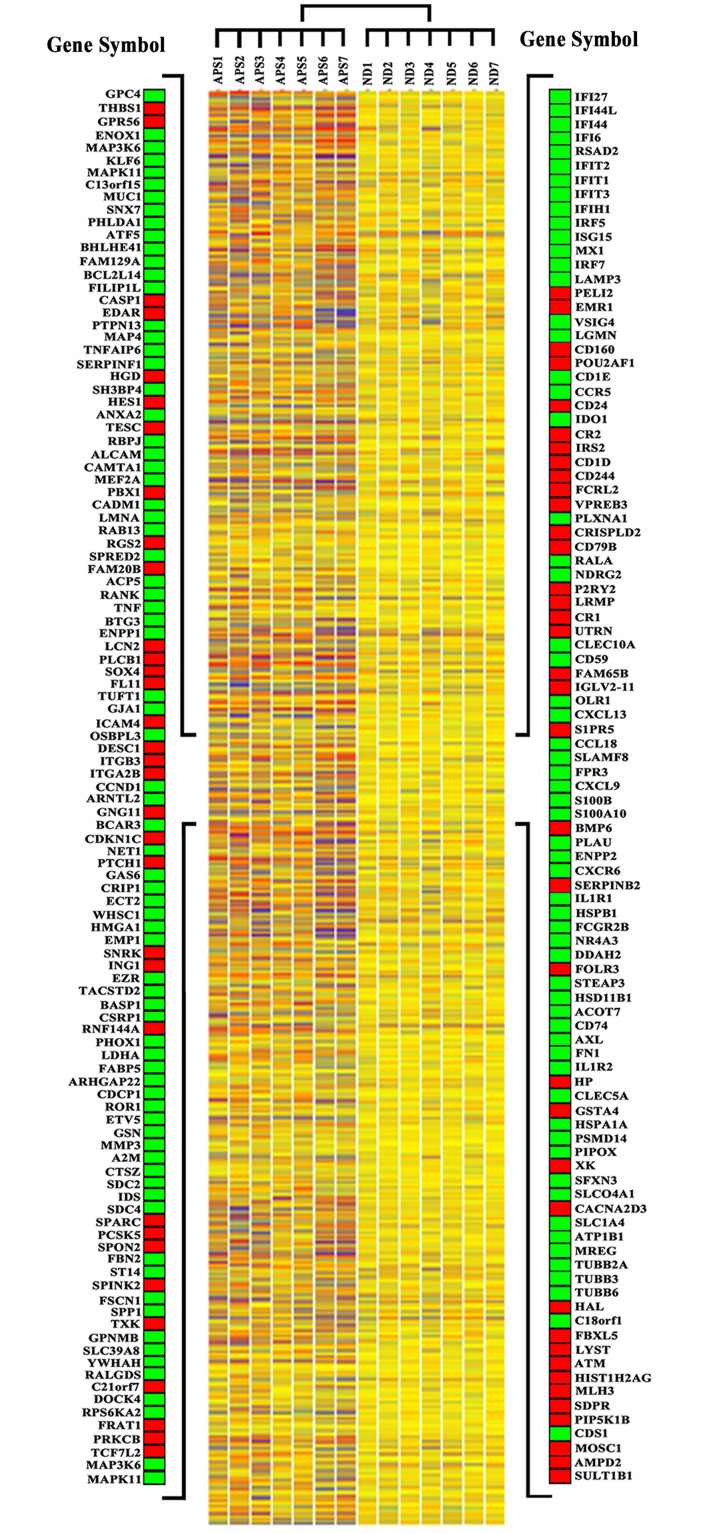
Fig 1. Gene expression profiles of synovial membranes obtained from 10 PsA patients and from 10 healthy subjects.
The heat map shows the expression levels of all the modulated genes. Blue-violet indicates genes that are expressed in synovial biopsies of PsA patients at lower levels when compared with the mean values of the control subjects, orange-red indicates genes that are expressed at higher levels when compared to the control means and yellow indicates genes that are not differently expressed in the patients group versus the control group. Each row represents a gene; each column shows the expression of selected genes in each individual (see S1 Table for complete list of genes expression data). On both sides of the heat map a selection of genes is shown. Green and red squares indicate upregulated and downregulated genes respectively.

