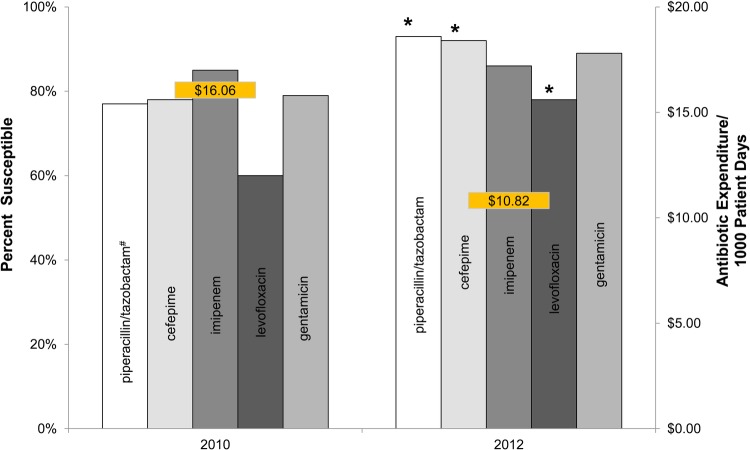
Figure 1.
Antimicrobial susceptibility of Pseudomonas aeruginosa with corresponding antimicrobial expenditures of first year compared to third year after establishment of a community antimicrobial stewardship program. Left axis is percentage of organism susceptible from corresponding annual antibiogram. Right axis is annual antimicrobial expenditure in dollar per patient day. *Statistically significant difference in antimicrobial susceptibility from 2010 to 2012 (P ≤ .01); #Piperacillin/tazobactam from 2009 due to unavailable results in 2010.

