Figure 6.
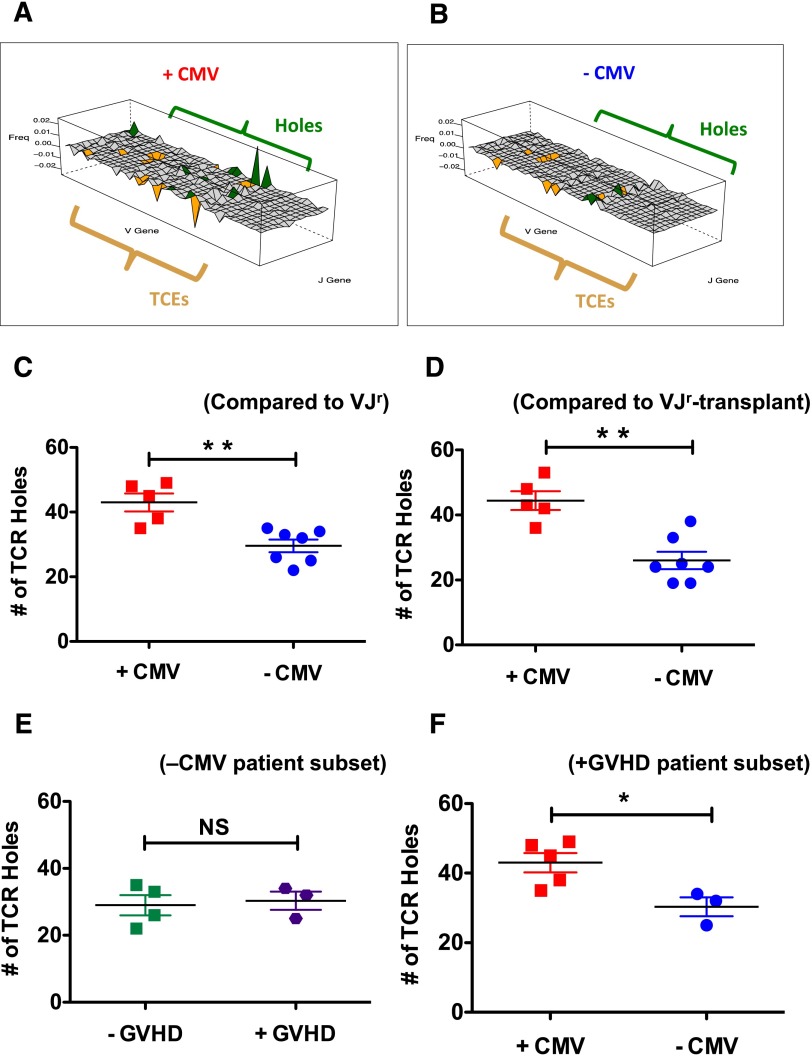
Impact of CMV reactivation on CD8 Tem TCR repertoire holes. (A-B) For panels A-B, V, and J genes are represented along the x-y axes, whereas the difference in the V-J–specific proportions of unique clones are represented along the z-axis and labeled “Freq.” TCE and holes analysis was performed as described in “Methods.” Panels A and B depict wireframe 3-dimensional graphs (created using the Lattice graphics package in R) for 2 representative patients (001-008, panel A and 001-005, panel B). Both TCEs and holes in the TCR repertoire are depicted in these graphs, with V-J families in orange depicting TCEs and those in green depicting holes. Those families shown in light gray are already sparse in the VJr and thus were not evaluated for holes. (C) Summary analysis showing the mean number of holes in the CD8 Tem from the +CMV (red squares) and −CMV (blue circles) patients using the VJr. **P < .01. (D) Summary analysis showing the mean number of holes in the CD8 Tem from the +CMV (red) and −CMV (blue) patients using the VJr-transplant. **P < .01. (E) Analysis of the number of holes in −CMV patients that either did not develop GVHD (green squares, left) or did develop GVHD (purple hexagons, right) compared with the VJr. P = 1.0. (F) Analysis of the number of holes in +GVHD patients that either did reactivate CMV (red squares) or did not reactivate CMV (blue circles) compared with the VJr. *P < .05.

