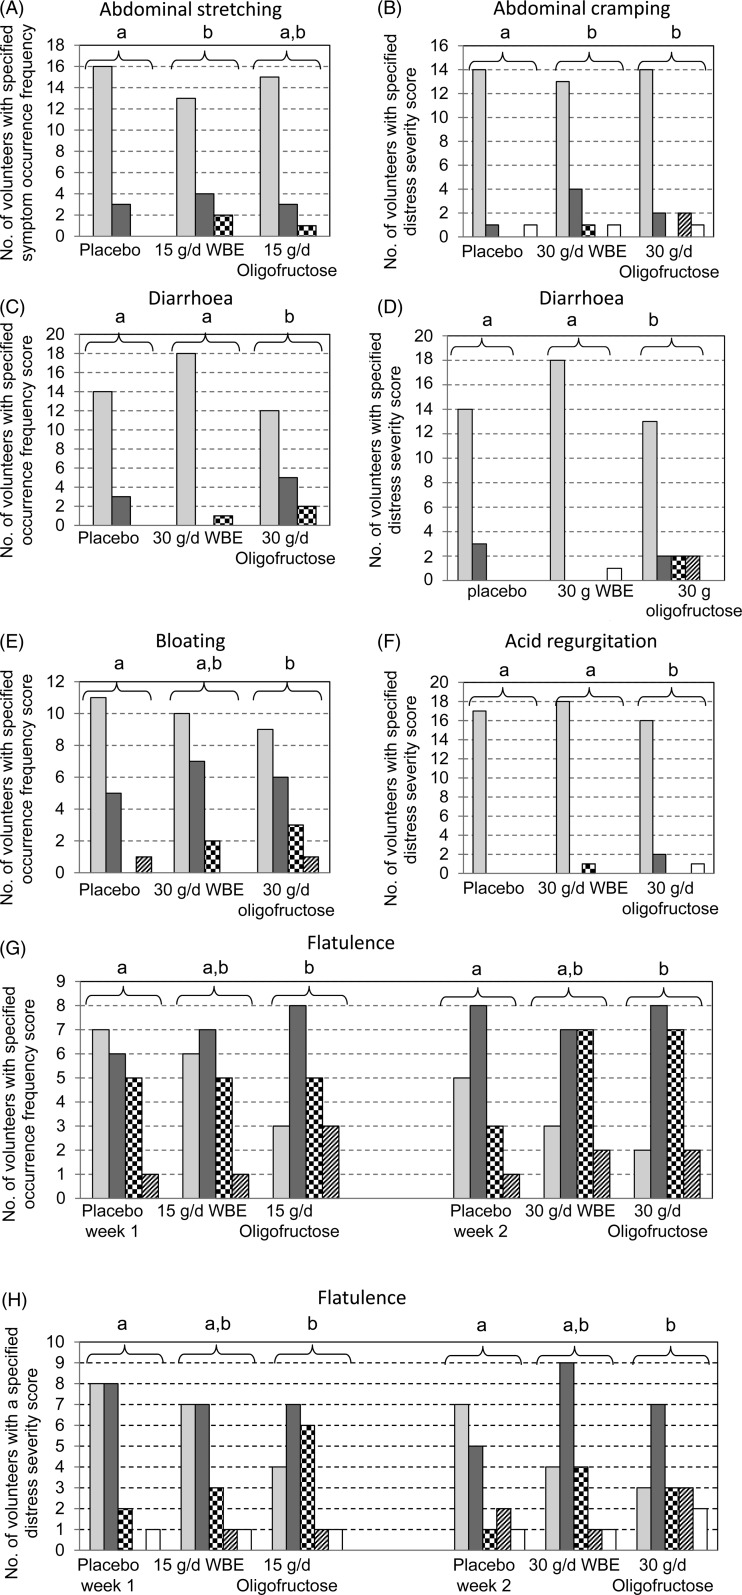
Fig. 3.
Distribution of occurrence frequency and distress severity of gastrointestinal symptoms. (A) Abdominal stretching occurrence frequency; (B) abdominal cramping distress severity; (C) diarrhoea occurrence frequency; (D) diarrhoea distress severity; (E) bloating occurrence frequency; (F) acid regurgitation distress severity; (G) flatulence occurrence frequency; (H) flatulence distress severity. Scores for occurrence frequency: score 0, never ( ); score 1, occasionally (
 ); score 2, frequently (
 ); score 3, nearly always (
 ). Scores for distress severity: score 0, no distress (
 ); score 1, minimal distress (
 ); score 2, mild distress (
 ); score 3, moderate distress (
 ); score 4, severe distress (
 ). a,b Groups of bar charts with unlike letters above the brackets represent statistically different distributions (P < 0·05). WBE, wheat bran extract.

