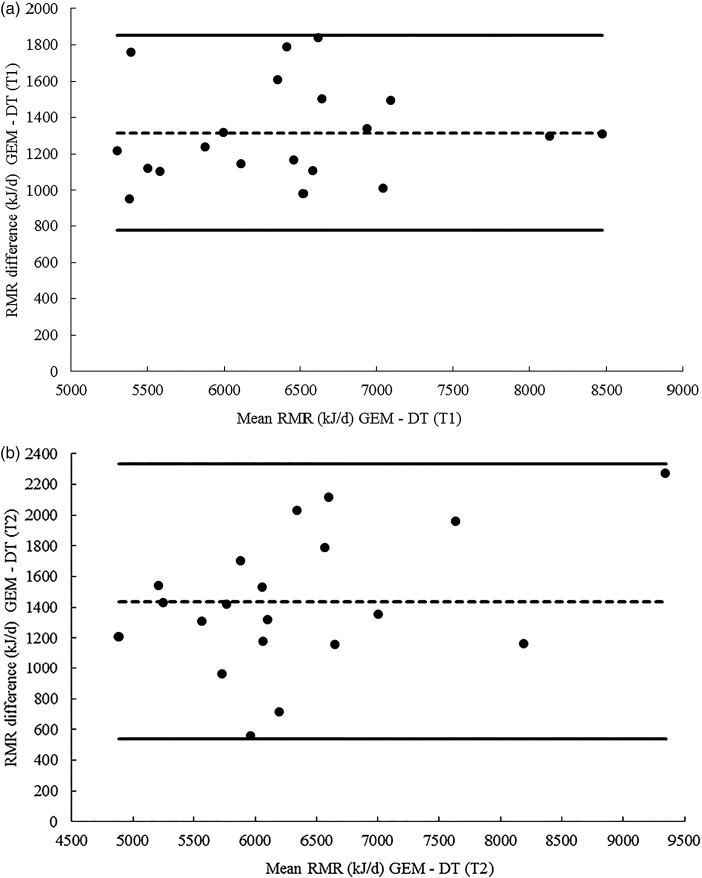
Fig. 2.
(a) Bland–Altman plot of mean difference in RMR measures collected on the GEM and the Deltatrac (DT) on test day 1 (T1).  represents the upper and lower 95 % limits of agreement.
  indicates the mean bias. The lower 95 % limit of agreement was 776 kJ/d and the upper 95 % limit of agreement was 1852 kJ/d. Difference was calculated as GEM minus DT. (b) Bland–Altman plot of mean difference in RMR measures collected on the GEM and the DT on test day 2 (T2).
  represents the upper and lower 95 % limits of agreement.
  indicates the mean bias. The lower 95 % limit of agreement was 536 kJ/d and the upper 95 % limit of agreement was 2332 kJ/d. Difference was calculated as GEM minus DT.

