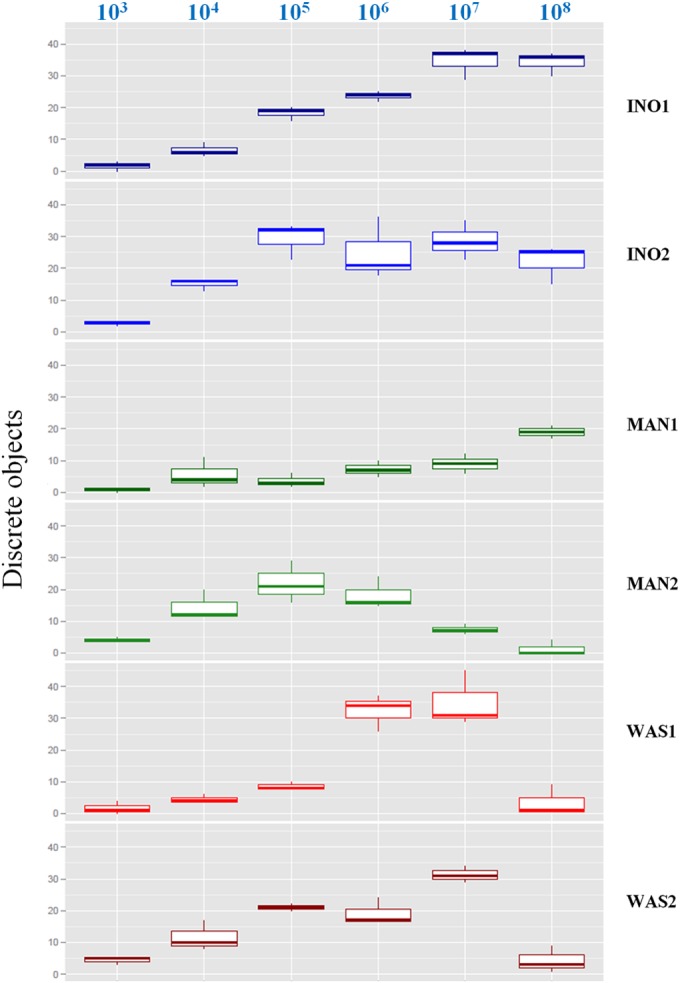
FIG 3.

Performance of manual, InoqulA, and WASP plate inoculations at different bacterial concentrations of E. coli. Shown are box-and-whisker plots (representing the minimum, first quartile, median, third quartile, and maximum) of the number of discrete colonies following InoqulA (INO1 and INO2), manual (MAN1 and MAN2), and WASP (WAS1 and WAS2) plate inoculations of different bacterial concentrations of E. coli ranging from 103 to 108 CFU/ml (top).
