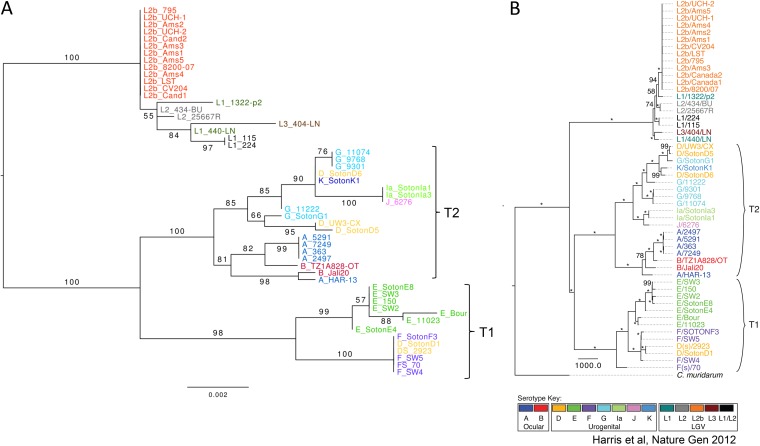
FIG 2.
Comparison of phylogenetic trees obtained from 52 strains by maximum likelihood analysis after removal of recombination events. (A) MLST concatemer of five targets; (B) whole-genome sequences (reproduced from reference 29 by permission from Macmillan Publishers Ltd.). Numbers on nodes represent percentage of bootstrap replicates supporting each clade. Asterisks indicate 100% support. The tree in panel A was rooted based on the previous study whose results are shown in panel B.

