
Figure 1. The brain regions in ECNs and the FC between IGD and HC groups.
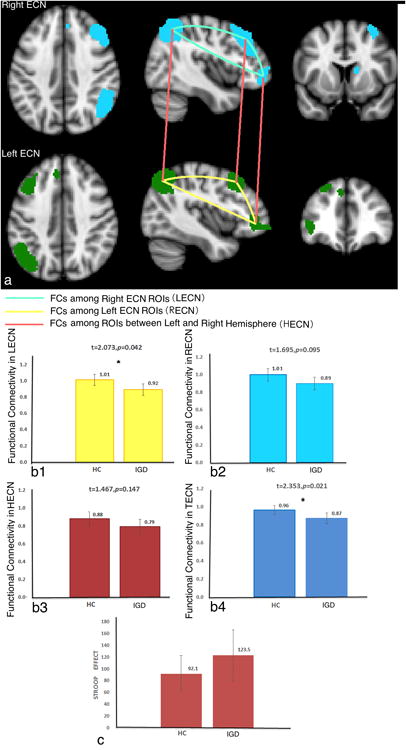
a, The ROIs that were used in left and right ECNs and the FC calculated among ROIs are displayed. For each ROI, a representative BOLD time course was obtained by averaging the signal of all the voxels within the ROI. The ECN templates were downloaded from Stanford's Functional Imaging in Neuropsychiatric Disorders lab (http://findlab.stanford.edu/functionalROIs.html).
b1-b4, The FC values between IGD and HC subjects are displayed in different ECNs. We used four ECNs in our study: LECN, RECN, HECN, and TECN.
c, The Stroop effect between IGD and HC groups is displayed.