
Figure 4.
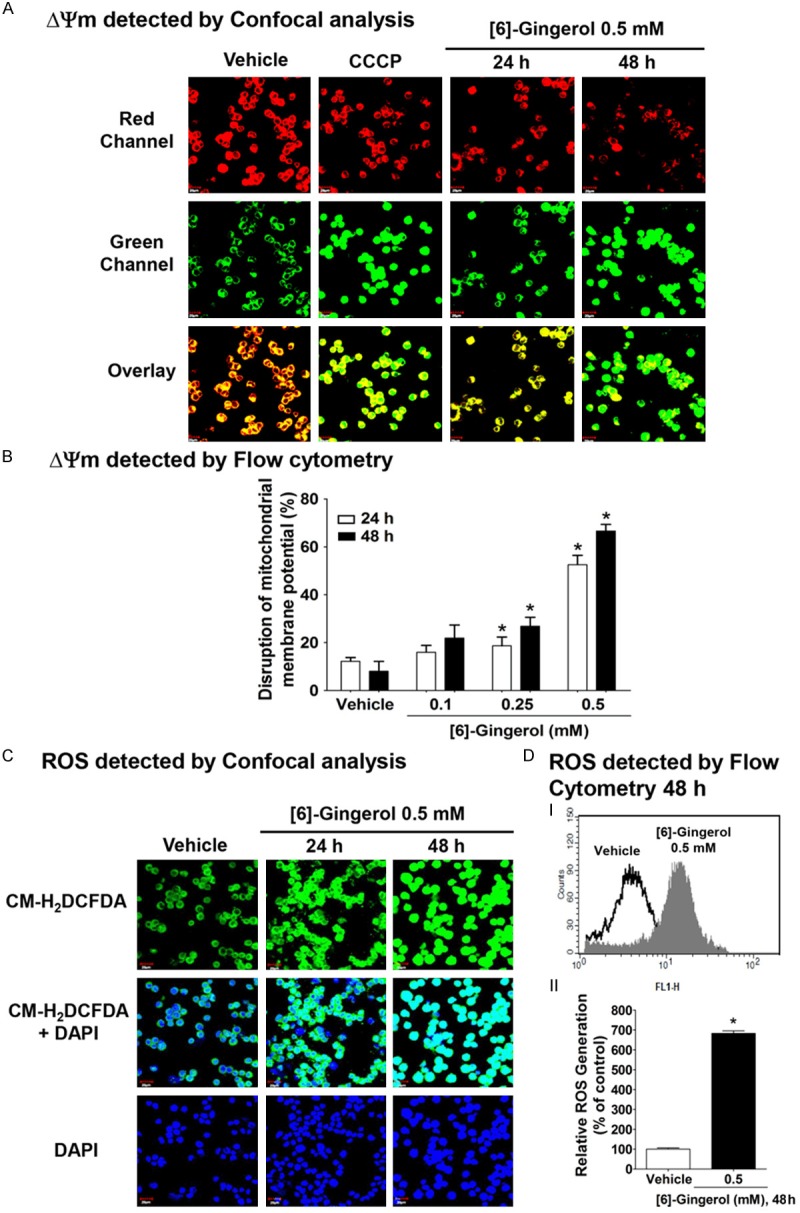
[6]-Gingerol disrupted the mitochondrial membrane potential (ΔΨm) and promoted ROS production in HepG2 cells. A. Confocal imaging of ΔΨm of HepG2 cells treated with vehicle (0.1% DMSO), 0.5 mM [6]-gingerol for 24 h and 48 h and then labeled with JC-1 fluorochrome and examined by confocal microscopy. Cells incubated for 10 min with carbonyl cyanide m-chlorophenylhydrazone (CCCP) is a proton ionophore that dissipates the mitochondrial membrane potential (predominantly green) was used as a positive control. B. Flow cytometery of ΔΨm in HepG2 cells treated with vehicle, 0.1, 0.25, or 0.5 mM [6]-gingerol for 24 or 48 h and then labeled with JC-1. C. Confocal imaging of ROS production after treatment with vehicle or 0.5 mM [6]-gingerol for 24 and 48 h. and then visualised using the ROS sensitive dye CM-H2DCFDA (green) and counterstained with DAPI (blue). DI. Flow cytometery showing ROS generation after treatment with vehicle or 0.5 mM [6]-gingerol for 48 h. II. Quantitation of ROS generation from flow cytometry of CM-H2DCFDA stained cells relative to vehicle alone (100%). Each data point is the mean ± SD of 3 independent experiments. *P <0.05 comparing vehicle only.