
Figure 5.
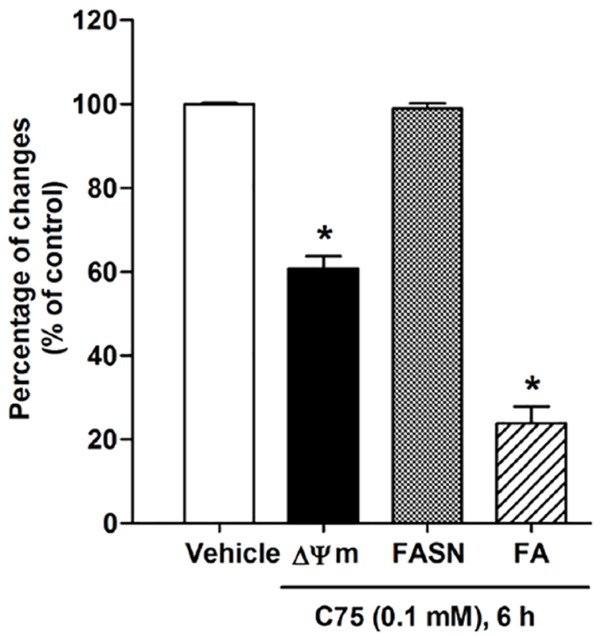
C75 induced apoptosis and inhibited fatty acid synthesis in HepG2 cells. The effect was not mediated by FASN downregulation. Cells were treated with 0.1 mM C75 for 6 h. ΔΨm was detected by flow cytometry and quantified by calculating the relative level of the red to green fluorescence emission of JC-1 fluorochrome. The disruption of ΔΨm decreased the red/green fluorescence intensity ratio of JC-1 fluorochrome. FASN protein expression was quantified as a ratio of the individual band protein intensity relative to the β-actin band intensity in the same blot (e.g. FASN/β-actin). Intracellular long chain fatty acid was determined by using the free fatty acid quantification kits. Three independent experiments were performed for statistical analysis and expressed as mean ± SD. *denotes statistically significant difference from the control at P<0.05.