Figure 3.

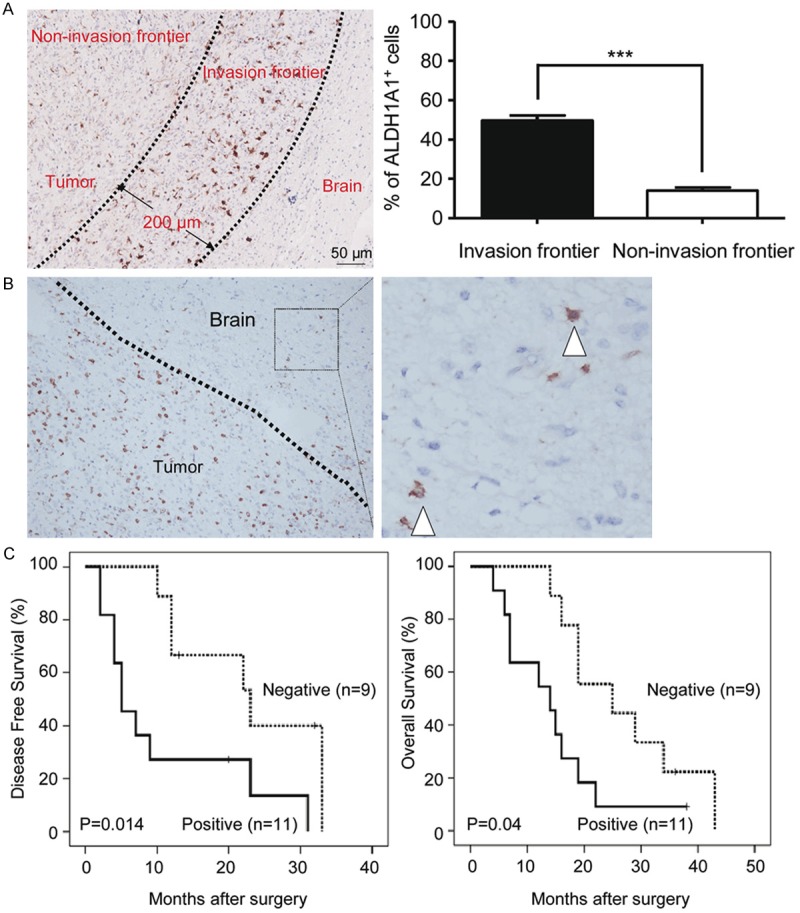
IHC analysis of ALDH1A1+ cells’ distribution in glioma specimens. A. Representative IHC images show the difference in the distribution of ALDH1A1+ cells between the invasive frontier area and the non-invasive frontier area. Two extending lines from the glioma are drawn to distinguish the invasive frontier area and non-invasive frontier area (left); Quantitative analysis reveals that ALDH1A1+ cells are increased in the invasive frontier area as compared to the non-invasive frontier area (right). B. Representative IHC images show ALDH1A1+ cells in the “normal” brain tissue adjacent to the invasive frontier. C. Kaplan-Meier estimation performed on some of the glioma patients indicates that the patients (n = 11) with ALDH1A1+ cells in the “normal” brain tissue adjacent to the invasive frontier have shorter disease-free survival time than those (n = 9) with less or no ALDH1A1+ cells. (P < 0.001, log-rank test). Data in A presented as the mean ± SEM. The Student’s t-test was used for between ALDH1A1high and ALDH1A1low analysis. ***indicates significant difference (P < 0.001).
