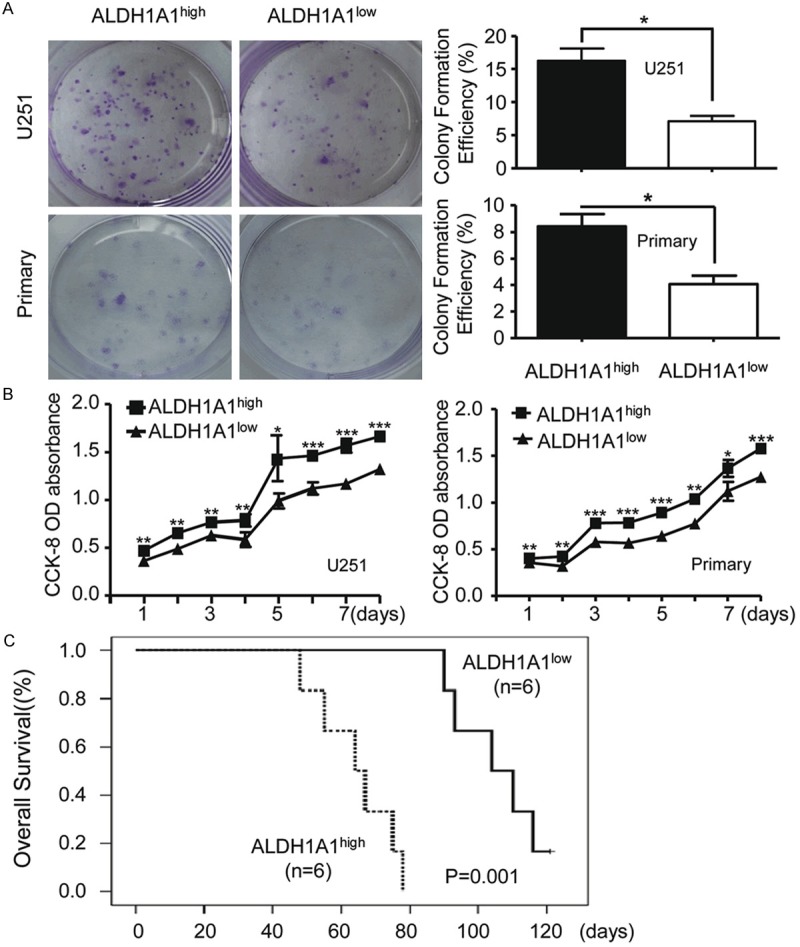
Figure 4.

ALDH1A1 glioma cells are capable of colony formation and proliferation. A. Colony formation of FACS-sorted ALDH1A1+ and ALDH1A1- cells yielded from U251 and primary glioblastoma cells (left). Quantitative analysis shows significant difference between colony formation by ALDH1A1+ and that by ALDH1A1- cells (right). B. Quantitative analysis by cell counting kit-8 (CCK8) assay shows significant difference between proliferation capability by ALDH1high and that by ALDH1low cells isolated from U251 and primary glioma cells. C. Kaplan Meier survival curve of overall survival (OS) indicates the association between FACS-sorted ALDH1A1+ and ALDH1A1- cells of U251 cells in SCID. Animals xenografted with ALDH1A1+ cells had a mean OS of 64 days as compared to 89 days for those with ALDH1A1- ones. (P = 0.001, log-rank test). Each value is the mean ± SEM. The Student’s t-test was used for between ALDH1A1high and ALDH1A1low analysis. *indicates significant difference (P < 0.05), **P < 0.01, ***P < 0.001.
