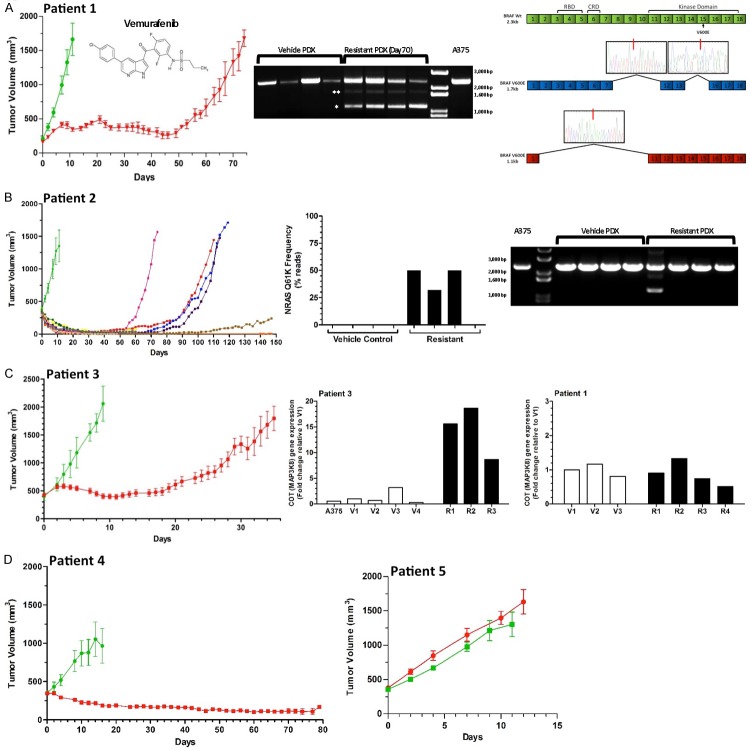
Figure 1.
BRAFV600E PDX tumor responses to Vemurafenib treatment reveal multiple resistance mechanisms. Mice were treated with either vehicle control or Vemurafenib (50 mg/kg orally, twice daily, 5 d on, 2 d off) for up to 150 days. The structure of Vemurafenib is displayed inside panel A. All vehicle treated tumors from patients 1-3 (green lines - ≥ n=4) rapidly increased in size. Chronic exposure to Vemurafenib (red line, except in panel B) produced differing responses among these PDX models. Y-axis values represent the mean tumor volume ± SEM (except for panel B) for each treatment group. A. Patient 1 tumors showed a significant, uniform response to Vemurafenib (n=11 started on treatment) with tumor growth inhibited for 50 d, after which acquired resistance emerged in all mice. Sampling of whole-tumor sections revealed progressively increased pERK expression by IHC staining (lower left panel) during treatment (day 50) and after resistance (day 70), with inter- and intra-tumor heterogeneity. Alternative splicing of the BRAF V600E gene was found in all four resistant tumors, but not in control vehicle-treated tumors or in A375 cells. Note that the dominant isoform is the 1.1 kb isoform (upper right, single asterisk), not the the 1.7 kb isoform (two asterisks). B. Patient 2 tumor growth is plotted for each individual mouse due to at the heterogeneous response to treatment with Vemurafenib (n=12 started on treatment). Resistant tumors with NRASQ61K mutations (frequency 33-50%) were present in three of four tumors examined; one resistant tumor lacked this point mutation, but had an alternatively spliced BRAFV600E isoform of 1.1 kb. C. Patient 3 tumors showed a significant, uniform response to Vemurafenib (n=13 started on treatment) with tumor growth inhibited for 20 d, after which resistance emerged in all mice. No alternative BRAF splicing or NRAS mutations were observed. Three of the resistant tumors had elevated COT expression (lower right panel) relative to vehicle-treated tumors and to tumors isolated from patient 1. D. Patient 4 tumors displaying a reduction in tumor volume in response to chronic Vemurafenib treatment (n=12 started on treatment) did not develop resistance over the course of the study (80 days). Y-axis values represent the mean tumor volume ± SEM for each treatment group. The fidelity of the PDX model system is confirmed by the patient 5 BRAFV600V tumors which did not respond by growth inhibition to either vehicle (n=5) or Vemurafenib (n=8). Y-axis values represent the mean tumor volume ± SEM for each treatment group.

