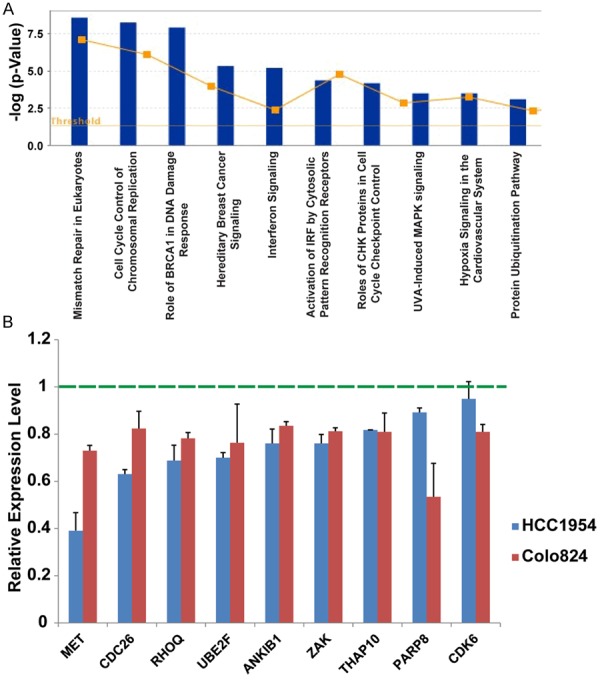
Figure 4.

Gene expression changes with NCDM-32B inhibitor treatment in breast cancer. A. Ingenuity Pathway Analysis of the top pathways affected in differentially expressed genes in breast cancer after NCDM-32B treatment. The Y-axis is an inverse indication of P value or significance. B. qRT-PCR-validated mRNA microarray data in HCC1954 and Colo824 cells after NCDM-32B treatment.
