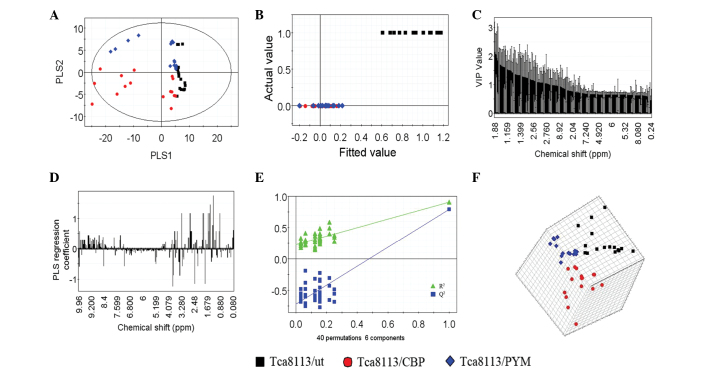
Figure 5.
PLS-DA revealing the extracellular metabolomic differences of the three cell lines. (A) PLS1 vs. PLS2 plot of the three groups demonstrates strong separation. (B) Score plot of actual value against the fitted class value. (C) Plot of VIP. (D) Coefficient plot for the predictive component. (E) Internal validation of the aforementioned model. (F) Three dimensional score plot, demonstrating where the three groups were located in space. PLS-DA, partial least squares discriminant analysis; ut, untreated; CBP, carboplatin; PYM, pingyangmycin; VIP, variable influence on projection.

