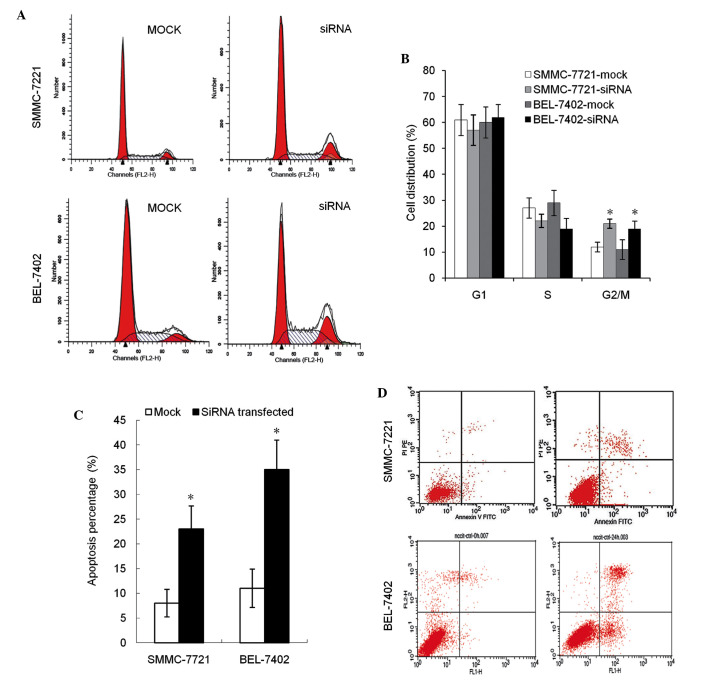
Figure 2.
Summary of G2/M phase distribution and the percentage of apoptotic cells. The transfected group demonstrated a significant increase in the (A and B) G2/M phase cell cycle distribution and (C and D) percentage of apoptotic cells. *P<0.05 vs. mock control. si RNA, small interfering RNA; FITC, fluorescein isothiocyanate.

