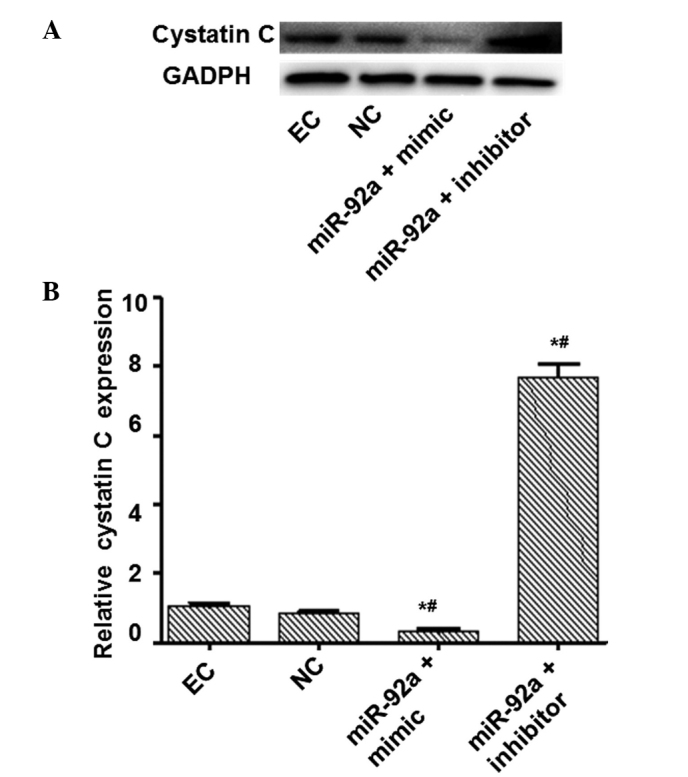
Figure 2.

Analysis of cystatin C protein expression. Endothelial cells were transfected with miR-92a mimic and inhibitor. At 48 h after transfection, cells were collected and cystatin C protein expression levels determined by western blot analysis. GAPDH was used as an internal control. Representative and quantitative western blot analysis results are presented. *P<0.05 vs. the EC group. #P<0.05 vs. the NC group. EC, endothelial control; NC, negative control; miR, micro RNA.
