Fig. 9.
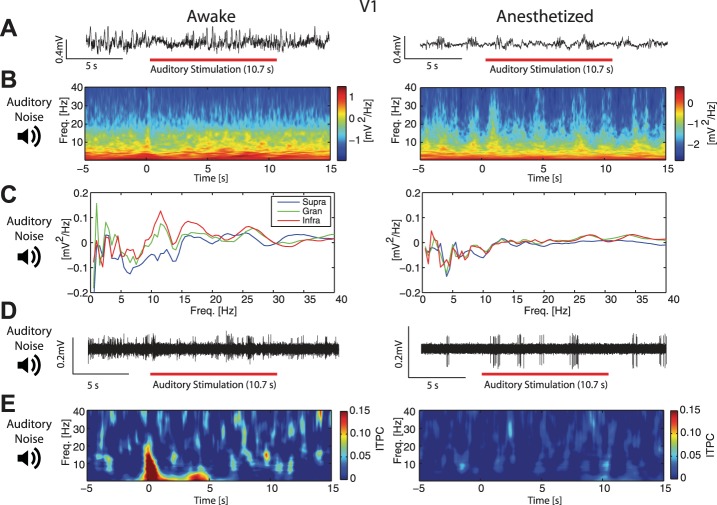
V1 spectral modulation and increase in ITPC by auditory stimulation were suppressed by anesthetics. A: representative LFP traces from infragranular layers in V1 in an awake (left) and 1.0% iso with xylazine anesthetized (right) animal during auditory stimulation. Red bars indicate presentation of the auditory stimulus. B: spectrograms of single recordings from V1 in awake (left) and 1.0% iso with xylazine anesthetized (right) animals. In awake animals, the onset of the auditory stimulus at time = 0 s induced spectral modulation. Plots show averages across cortical layers. C: group-averaged ratio of V1 spectral power during auditory stimulation to spectral power during spontaneous activity, by cortical layer. Left: in awake animals, the strongest effect of auditory stimulation on spectral power was found at low frequencies in the granular layer and in the alpha-band in infragranular layers. Right: these dynamics were absent in anesthetized animals. D: representative traces of high-pass filtered MU spiking activity from V1 infragranular layers in an awake (left) and 1.0% iso with xylazine anesthetized (right) animal during auditory stimulation. E, left: auditory stimulation elicited increased group-averaged phase-coherence in V1 of awake animals. Right: in V1 of anesthetized animals, there was no detectable increase in group-averaged phase-coherence induced by auditory stimulation. Plots show averages across cortical layers.

