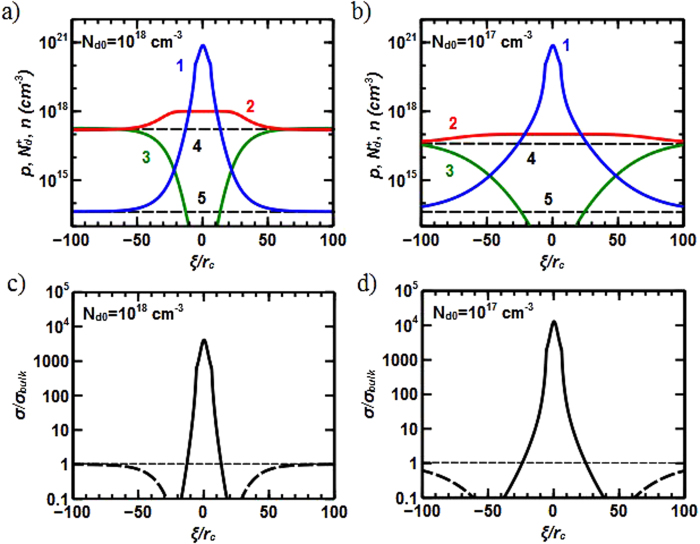
Figure 3.
Dependencies of the hole density, p(ξ) (blue curves 1); positively charged donor density  (red curves 2), and; electron density, n(ξ) (green curves 3) for the concentration of n donors in the bulk: (a) Nd0 = 1018 cm−3 ; (b) Nd0 = 1017 cm−3. The incline angle is θ = π/4. Dashed lines 4 and 5 correspond to saturated values of the electron and hole densities at large distance from the tail-to-tail domain wall. The values of local conductance to bulk (electronic) conductance ratio for θ = π/4, and: (c) Nd0 = 1018 cm−3; (d) Nd0 = 1017 cm−3 (the solid line relates to the holes conductance; dashed – to the corresponding electron contribution). ξ is measured in the units of the coherence radius rc.

