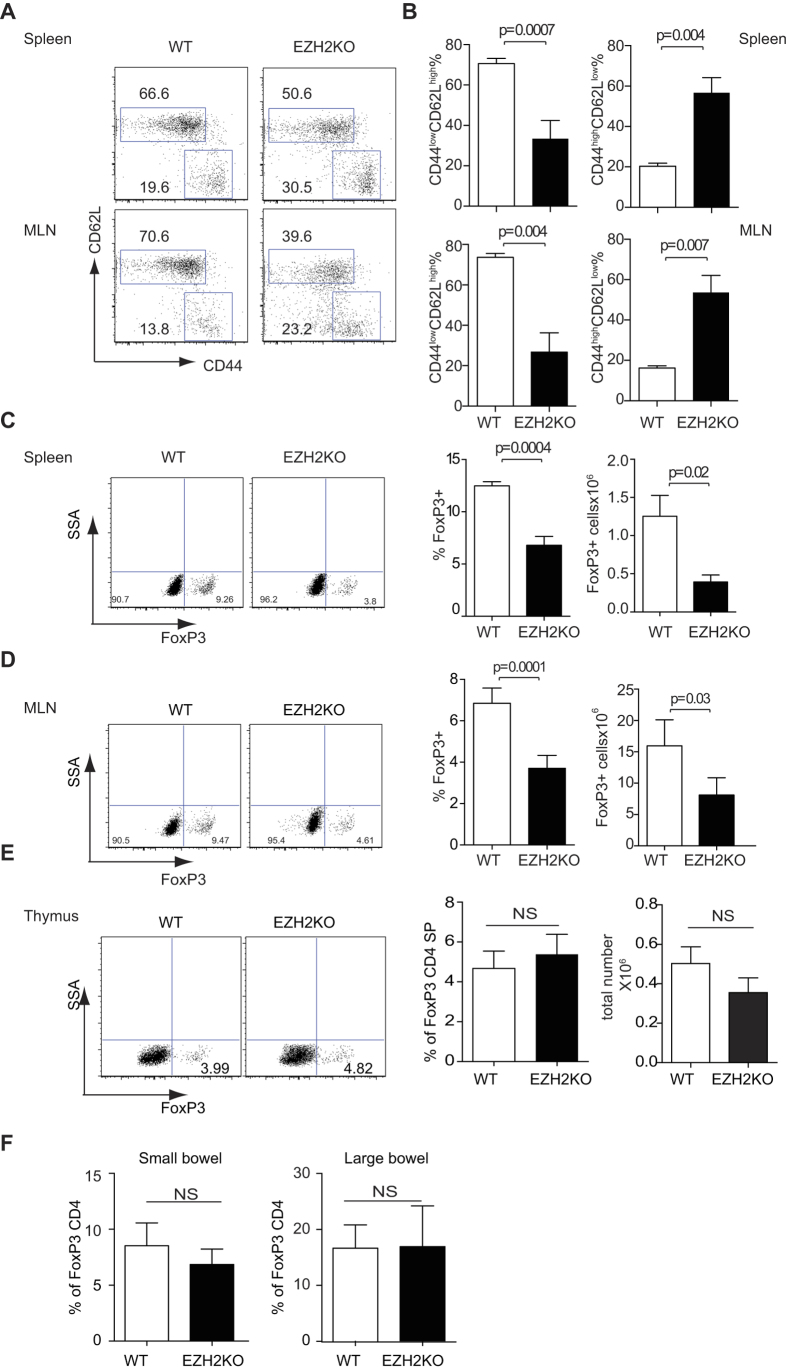
Figure 1. Ezh2-deficient mice have fewer naïve T cells in their periphery.
(A) CD44 and CD62L expression of spleen and mesenteric CD4+ T cells from control and Ezh2-deficient mice. Data are representative of six independent experiments. (B) Cumulative histogram showing percentage of CD4+CD44lowCD62Lhigh and CD4+CD44highCD62Llow in the spleen and mesenteric lymphocytes of control and Ezh2-deficient mice. *P < 0.05 and **P < 0.01 (unpaired t-test) (n = 6). FOXP3 expression in CD4+ T cells as measured by intracellular staining and flow cytometery of lymphocytes from the spleen (C) mesenteric lymph nodes (D), thymus (E), small and large bowel (F). Representative dot plots demonstrating FOXP3 expression are shown on the left, histograms showing pooled data depicting the average proportion of FOXP3+ cells together with total numbers of FOXP3+ cells are shown on the right, error bars denote the s.e.m. *P < 0.05 and **P < 0.01 (unpaired t-test) (n = 3) (C–E). (F) Histograms depict average percentage of FOXP3+ T cells as a proportion of the total CD4+ population in the small and large bowel, error bars denote s.e.m. ns denotes no significance (n = 3).

