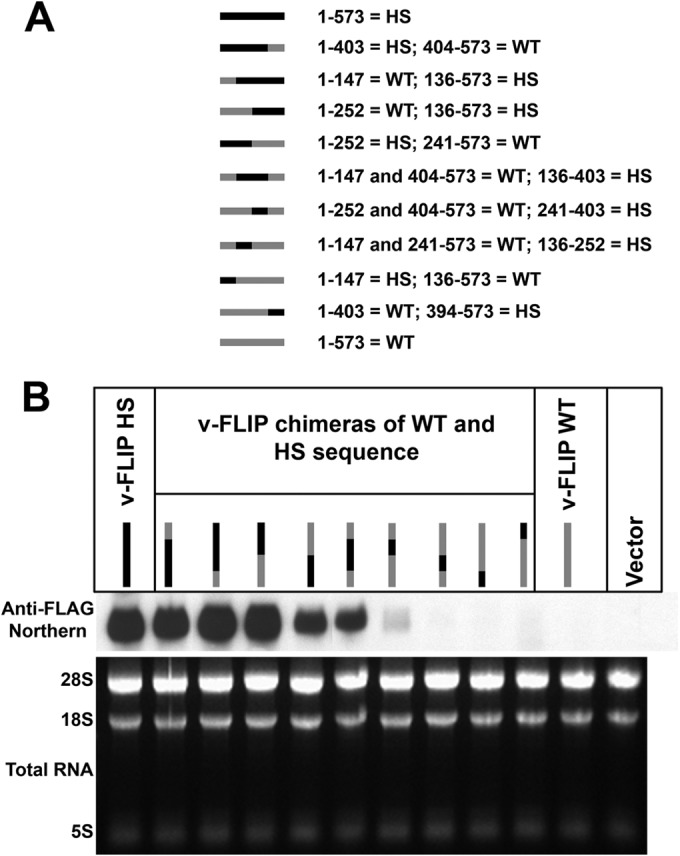
FIG 4.

Chimeras between wild-type and optimized sequences of the v-FLIP gene show correlation between amount of optimized sequence and abundance of RNA. (A) The chimeras are represented by gray (for wild-type sequences) and black (for optimized sequences), and the nucleotide positions of these regions are indicated alongside. Note that the regions between nt 136 and 147, nt 241 and 252, and nt 394 and 403 of the sequence are the same in wild-type and optimized v-FLIP genes. (B) Northern blot probing for the invariant 5′ FLAG tag on the chimeras using labeled probe against FLAG (upper panel). The lower panel depicts ethidium bromide staining of total RNA as a loading control.
