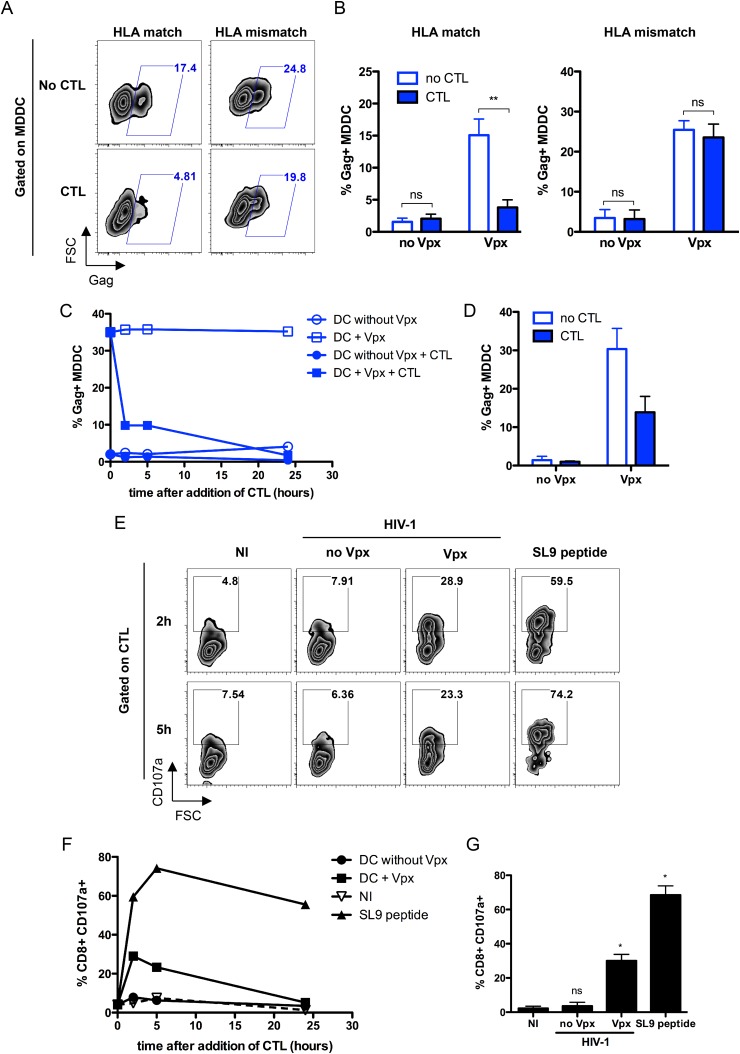
FIG 3.
HIV-1-specific CTL inhibit Vpx-mediated infection of MDDC through their cytotoxic activity. (A) Far-red-labeled HLA-A2+ (match) or HLA-A2− (mismatch) MDDC were pretreated with SIVmac VLP and exposed for 2 h to VSV-G-pseudotyped HIV-1 SF2 (2 ng p24/105 cells). After 24 h, cells were washed and incubated with either EM40F21 CTL at a 2:1 ratio or with medium alone for 24 h and then analyzed by flow cytometry. Plots are gated on far red+ cells, and values in each panel represent the percentage of Gag+ cells in Vpx-treated MDDC. One representative experiment out of three is shown. (B) Graphs show mean numbers (± SD) of Gag+ MDDC from three independent experiments. Statistical significance was assessed by a two-way analysis of variance (ANOVA) test (**, P < 0.005; ns, nonsignificant [P > 0.05]). (C) MDDC were infected as described for panel A and incubated with either EM40F21 CTL or with medium alone. Cells were monitored for Gag expression by flow cytometry in DC-Sign+ cells after 2 h, 5 h, and 24 h of coculture. One representative experiment out of three is shown. (D) Mean numbers (± SD) of Gag+ MDDC after 2 h of culture with CTL are represented from two independent experiments. (E and F) MDDC were treated as described for panel C, and CD107a antibody was added directly into wells during coculture with CTL. MDDC loaded with SL9 peptide were used as a positive control. Cells were collected after 2 h, 5 h, and 24 h of culture and analyzed by fluorescence-activated cell sorting (FACS) for CD8, DC-Sign, and Gag expression. Plots are gated on CD8+ T cells, and values in each panel represent the percentage of CD107a+ cells. The graph represents percentages of CD8+ CD107a+ cells in one representative experiment out of three. (F) Mean (± SD) percentages of CD8+ cells expressing CD107a after 2 h of culture with MDDC are represented from three independent experiments. Statistical significance was assessed by a Mann-Whitney test (*, P < 0.05; ns, nonsignificant [P > 0.05]).

