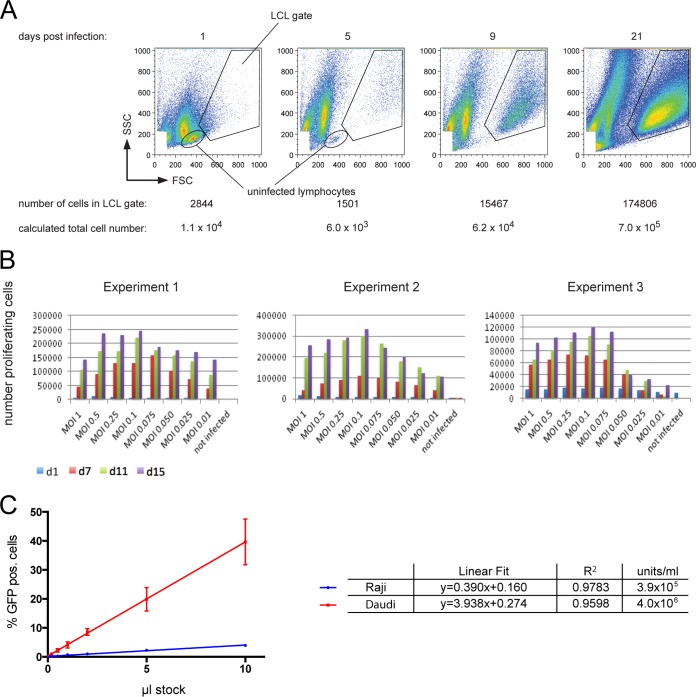
FIG 2.
Parameters and conditions optimally supporting EBV infection of primary B lymphocytes. (A) Determination of the number of proliferating, growth transformed cells after EBV infection. EBV-infected primary B lymphocytes increase in size and granularity to become B blasts, which can be detected in flow cytometry. The FSC (forward scatter) represents the size and the SSC (sideward scatter) represents the granularity of a cell. In contrast to noninfected, primary B cells, which exhibit low FSC/SSC signals, EBV-infected lymphoblasts locate to the “LCL gate” as indicated as early as 5 days p.i. In the experimental results shown, 6 × 10⁵ adenoid B cells were infected with wt EBV (MOI = 0.1 GRU). At 1 day p.i., infected cells were supplied with fresh medium and divided into four fractions at a concentration of 1.5 × 10⁵ cells/ml each. At 1, 5, 9, and 21 days p.i., one fraction was quantitatively analyzed by flow cytometry as indicated, and the total number of growth-transformed cells was calculated with the aid of a known number of APC beads, which provide a volume standard for sample normalization. The figure shows an example of a typical experiment with BCR+ B cells infected with wt EBV. (B) Infection of primary B lymphocytes with different MOIs and cellular outgrowth over time. Unsorted B cells were infected with the indicated wt 2089 EBV. The different MOI values are designated in the figure. At the given time points, the absolute numbers of activated and proliferating cells in the LCL gate were determined by flow cytometry as in panel A. Three independent experiments are shown. (C) Titration of a wt EBV stock sample comparing the infectivity of Epstein-Barr virions in Raji versus EBV-negative Daudi cells. A total of 5 × 10⁴ Raji cells or 2 × 10⁵ Daudi cells were infected with the indicated volumes of a wt 2089 virus stock. Percentage of GFP-positive cells was assessed by FACS analysis at 3 days p.i. For comparison, the GFP values were adjusted to 105 cells total. Shown are the linear regressions and the coefficient of determination (R2) derived from three independent experiments.

