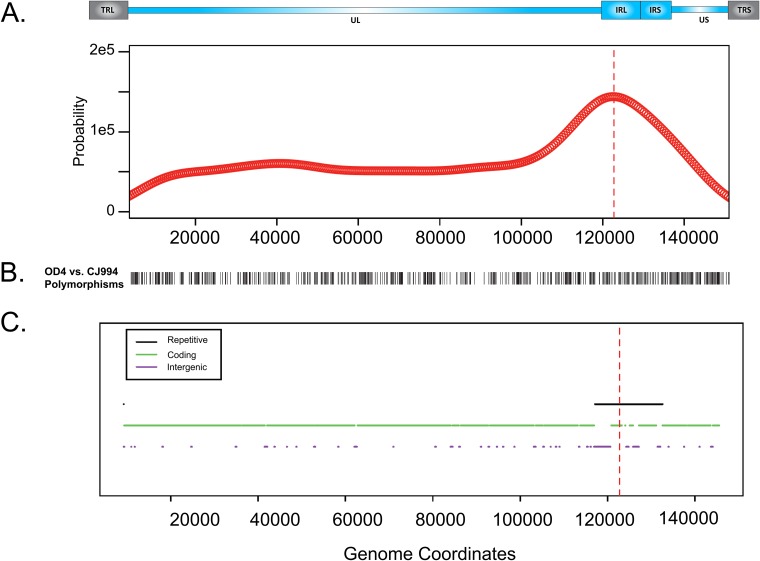
FIG 2.
Estimated probability density function for breakpoint occurrence across the genome. (A) Estimated probability density function of breakpoint occurrence in terms of HSV genome coordinates. An HSV-1 genomic map appears above the plot. This plot was calculated using a kernel density estimation approach, which centers a smooth Gaussian kernel function at each observed breakpoint and sums the influence from each Gaussian kernel function to determine an overall density estimate. (B) DNA polymorphisms between parental strains OD4 and CJ994 across the genome (terminal repeats were excluded). (C) Repetitive regions, protein-coding regions, and intergenic regions in the genome. For both plots, terminal repetitive regions were excluded from consideration to avoid overcounting of breakpoints in internal repetitive regions. Repetitive regions are hot spots for breakpoints. Red dashed lines, peak of the density function.

