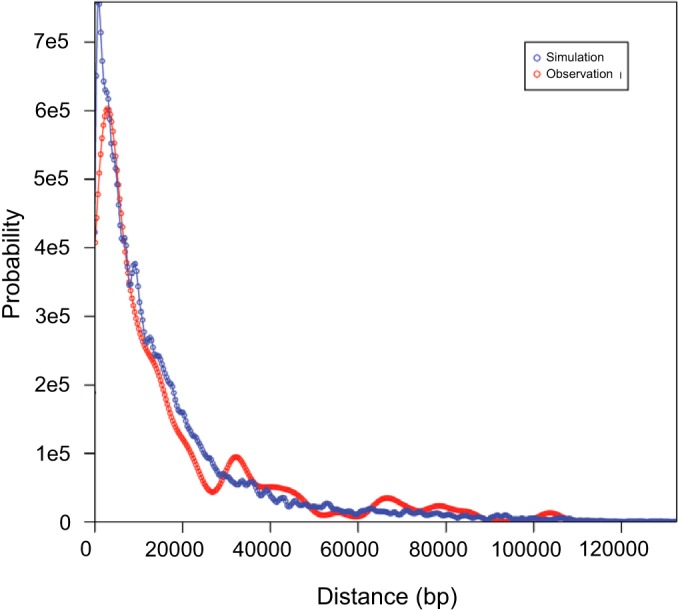
FIG 3.

Distribution of lengths between novel SNPs and the nearest breakpoints in actual and simulated data. Red curve, estimated probability density function representing the distance between novel SNPs and the nearest breakpoint in the actual recombinants; blue curve, distribution of simulated data from a Monte Carlo process in which simulated SNP coordinates and breakpoint coordinates were sampled independently from the observed distributions of these two variables. The curves were calculated using a kernel density estimation approach to obtain smoothed representations of both the actual distances and the simulated distances.
