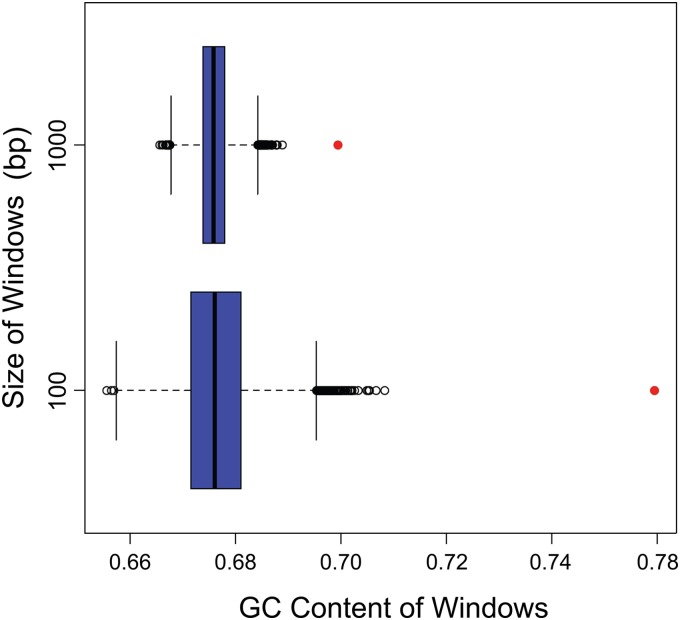
FIG 5.
GC content of windows around breakpoints. Red circles, GC content of windows around actual breakpoints. The top plot represents windows of 1,000 bases, and the bottom plot represents windows of 100 bases. The box plots show the GC content for windows around simulated breakpoints generated by the Monte Carlo process. The GC content for the observed breakpoint windows is located outside the whiskers' range, suggesting that there is a strong bias in GC content near breakpoints.

