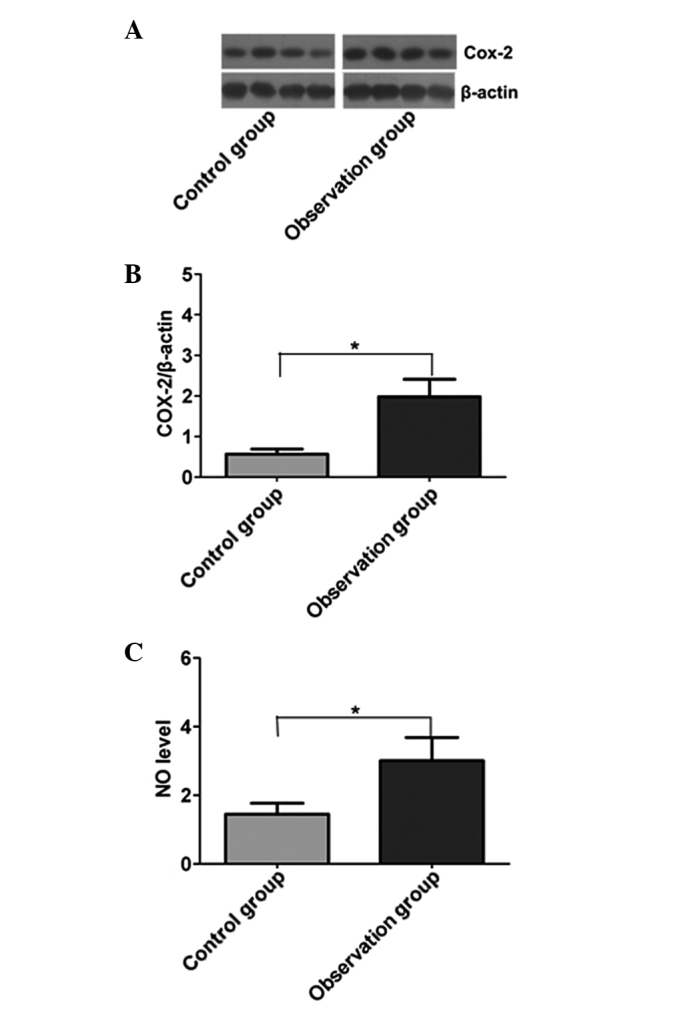
Figure 3.

Comparison of the protein levels of COX-2 and iNOS in the two groups. (A) COX-2 expression, as detected by western blotting. (B) Quantitative analysis of COX-2 expression. (C) NO expression. Results are presented as the mean ± standard deviation. *P<0.05. COX-2, cyclooxygenase-2; NO, nitric oxide.
