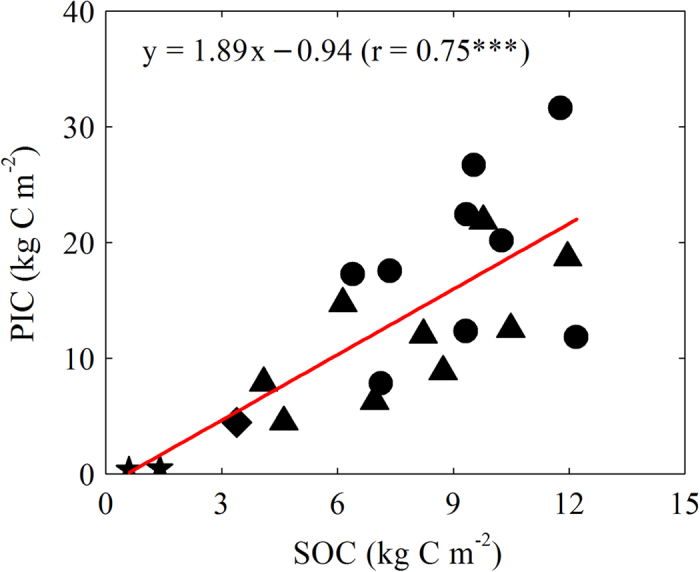
Figure 3. Relationship between pedogenic carbonate (PIC) and SOC stocks (0–100 cm).

Significance of the linear regression was marked with three (P < 0.001) asterisks. Symbols are the same as in Figure 1.

Significance of the linear regression was marked with three (P < 0.001) asterisks. Symbols are the same as in Figure 1.