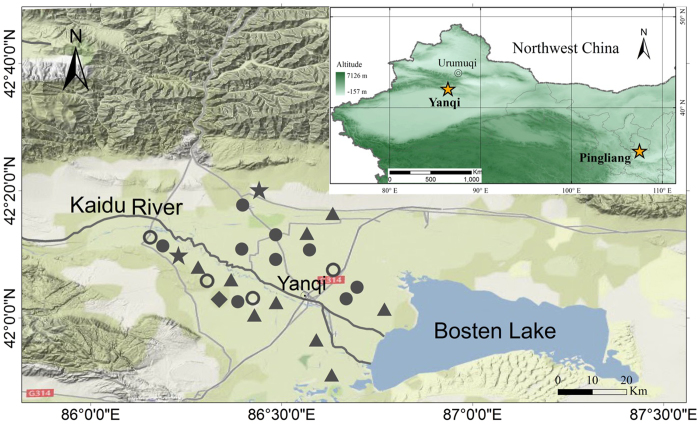
Figure 5. Map and sampling area in the Yanqi Basin and the location of the long-term experiment (LTE) in Pingliang, Gansu.
The maps were created using the ARC GIS 9.3. Symbols for the Yanqi Basin are the same as in Figure 1. Soil carbon contents were measured for all profiles, but δ13C only determined in those profiles marked with closed symbols.

