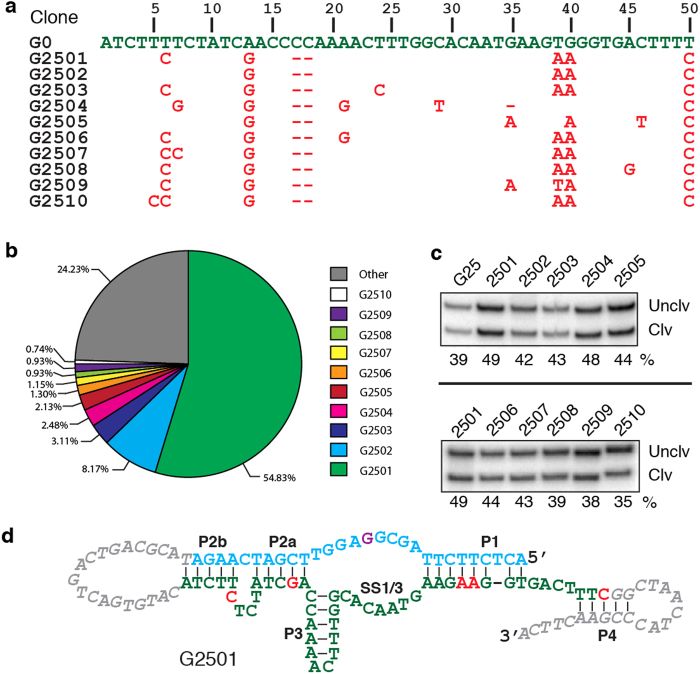
Figure 2. Catalytic DNA sequences from G25.
(a) Sequencing results. The G25 pool was sequenced and the top 10 sequences are listed (without primer binding sites). The first entry is the original BTA1 (G0). Mutations and deletions (indicated by “-”) in each G25 sequence are shown in red; unmutated nucleotides are omitted for clarity. (b) A pie chart showing the percentage of each top 10 sequence in the G25 pool. (c) Comparison of top 10 sequences for cleavage activity. The reaction time is 24 h. The G25 pool was used as a control. Cropped gels are used for better presentation and these gels were run under the same experimental conditions. The original uncropped gel images are provided in panel B of Figure S2 in the supplementary information. (d) A putative secondary structure of G2501.

