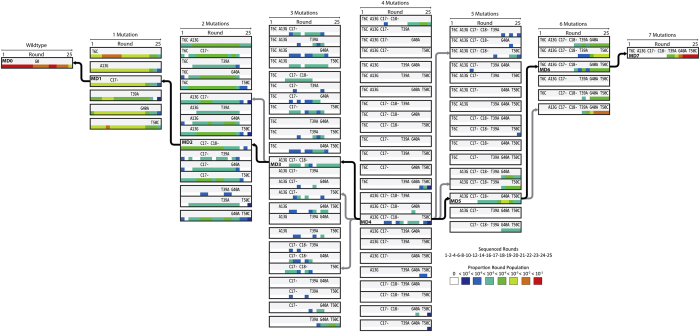
Figure 3. Identification of an evolutionary pathway.
Mutants comprising the sequence space defined by the 7 mutations observed in G2501 are arranged by increasing mutation number across columns from left to right. Sequences are arranged by mutation position from 5′ (top) to 3′ (bottom) within columns. The proposed pathway is anchored at the 4th mutation given the persistence of the A13G/C17-/C18-/T50C indicated by the darker shading. Arrows linking adjacent columns indicate mutants within a single mutation, black arrows indicate the favoured mutant. Color spectrum corresponds to the log binned proportion of each mutant within a round.

