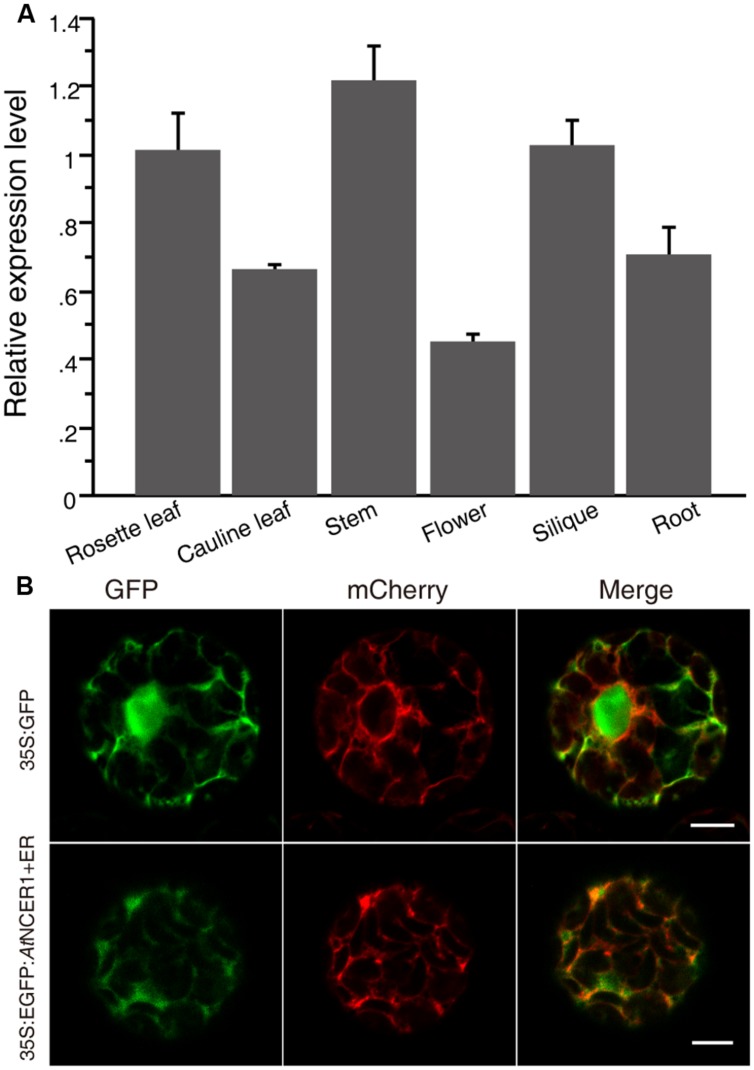
FIGURE 2.
Expression of AtNCER and subcellular localization of AtNCER. (A) Expression of AtNCER1 in different tissues. Reverse transcription quantitative PCR was used to measure the relative transcript levels of AtNCER1 in the indicated tissues. The transcript level of ACT2 was used as the internal control. Gene expression values are presented relative to the rosette average leaf level, which was set as 1, and error bars indicate SE. (B) Subcellular localization of AtNCER1. The fusion construct 35S:eGFP:AtNCER1 was co-expressed with the endoplasmic reticulum (ER) mCherry marker (TAIR, CD3-960) by transient expression in protoplasts. The 35S:GFP construct and the ER mCherry marker was transformed as a control. The images were photographed by confocal microscopy after 16 h incubation. The experiments were repeated at least three times with similar results. Bar = 5 μm.

