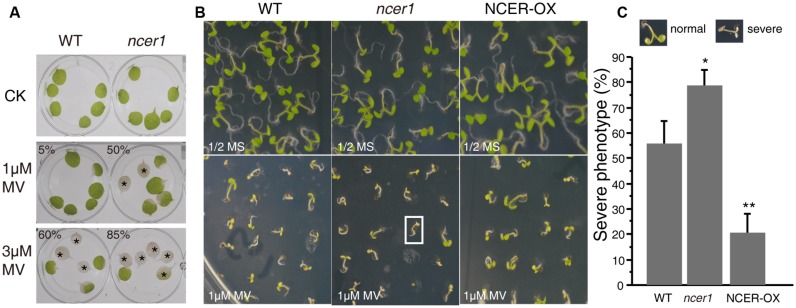
FIGURE 5.
Sensitivity of ncer1 mutants to oxidative stress induced by MV. (A) Disks from the third and fourth leaves of 14-day-old wild-type and ncer1 mutant plants were incubated with or without 1 μM or 3 μM MV for 3 days and then photographed. Asterisks indicate completely bleached, damaged leaf disks. At least 12 leaves of wild-type and ncer1 were observed in each experiment. Two independent tests were done. The ratio of the bleached area and the whole leaf area showed significantly difference from the wild type using Student’s t-test (p < 0.05). (B) The phenotype of wild type, ncer1, and NCER-OX seedlings after MV treatment. Seedlings were grown on 1/2 MS containing or without 1 μM MV for 10 days and then photographed. The white square indicates one seedling with a severe phenotype. (C) Percentage of seedlings with a severe phenotype after 1 μM MV treatment. At least 250 seedlings were counted in each genotype. Error bars indicate SD from three independent experiments. Asterisks indicate significant differences by Student’s t-test (p* < 0.05; **p < 0.01).

