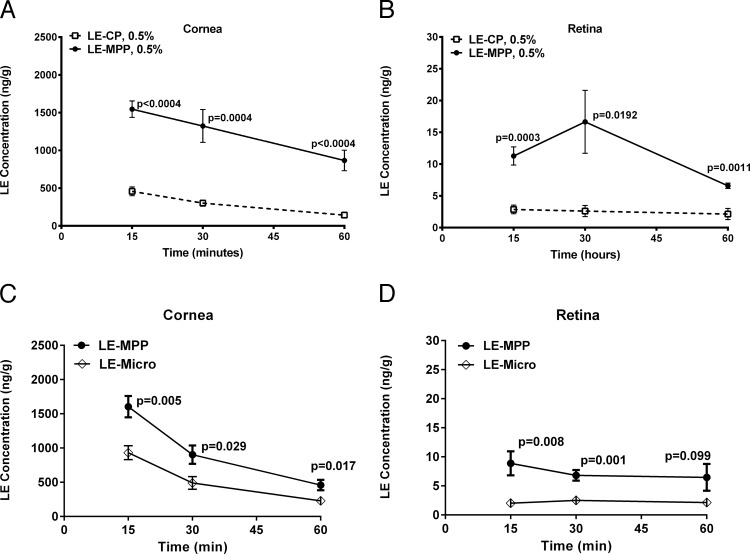
Figure 1.
The NZW rabbit ocular levels of LE following a single topical dose. (A) Corneal LE levels post-topical administration of 0.5% LE-CP or LE-MPP. (B) Retinal LE levels post-topical administration of 0.5% LE-CP or LE-MPP. (C) Corneal LE levels post-topical administration of 0.5% LE-MPP or LE-Micro. (D) Retinal LE levels post-topical administration of 0.5% LE-MPP or LE-Micro. All data are shown as mean ± SEM (n = 6 eyes). Statistical analysis was performed using the Holm-Sidak method multiple t-test, P values were shown on graphs, and are reflective of the differences between the MPP groups and the control groups (Fig. 1) or between dosed and nondosed eyes (Figs. 2, 4, 5).

