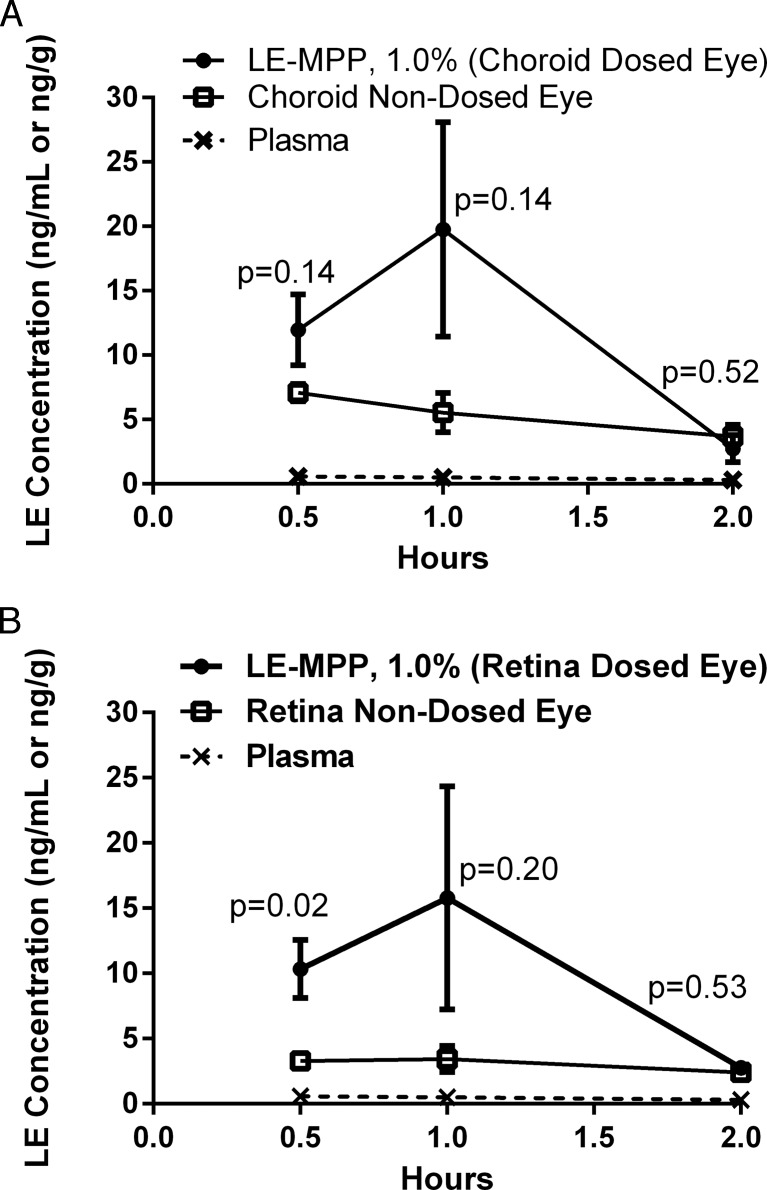
Figure 2.
The PK profiles of LE in pigmented rabbits after topical administration of LE-MPP. The mean LE concentrations ± SE (ng/g, n = 4) in choroid (A) or retina (B) were shown with the following symbols: dosed eyes (closed circles), nondosed eyes (open squares), plasma (x, dashed line). Statistical analysis was performed using the Holm-Sidak method multiple t-test, P values were shown on graphs as related to differences between dosed and nondosed eyes.

